

 31 October 2017
2017- n° 291Household consumption expenditure on goods bounced back in September (+0.9%) and increased
again over the third quarter (+0.7%) Household consumption expenditure on goods - September 2017
31 October 2017
2017- n° 291Household consumption expenditure on goods bounced back in September (+0.9%) and increased
again over the third quarter (+0.7%) Household consumption expenditure on goods - September 2017
In September 2017, household consumption expenditure on goods increased by 0.9% in volume*, after falling by 0.2% in August. Expenses on energy accelerated while food products' purchases bounced back. Over the whole third quarter, expenses on goods accelerated slightly (+0.7% after +0.6%), driven by expenditure on energy, clothing and household durables.
- Energy: acceleration in September and over the quarter
- Food products: upturn in September, decline over the quarter
- Engineered goods: virtual stability in September, acceleration over the quarter
- Durables: very slight increase in September, acceleration over the quarter
- Textile-clothing: increasing again in September, bouncing over the quarter
- Other engineered goods: fall in September, rebound over the quarter
- The variation in August 2017 is slightly revised upwards
In September 2017, household consumption expenditure on goods increased by 0.9% in volume*, after falling by 0.2% in August. Expenses on energy accelerated while food products' purchases bounced back. Over the whole third quarter, expenses on goods accelerated slightly (+0.7% after +0.6%), driven by expenditure on energy, clothing and household durables.

*Volumes are measured at chain-link previous year prices (2010 euro billions) and all figures are trading-day and seasonally adjusted.
graphiqueGraph1 – Total consumption of goods
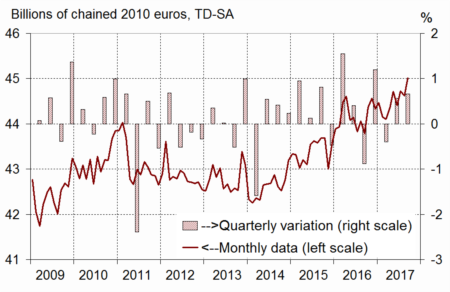
- Source: INSEE
Energy: acceleration in September and over the quarter
In September 2017, energy consumption accelerated (+3.3% after +0.4%). Fuels purchases increased sharply (+5.1%), as well as heating expenses, as a result of lower temperatures than the seasonal norm. Over the quarter, expenses on energy also accelerated (+1.6% after +0.5%).
graphiqueGraph2 – Breakdown of energy
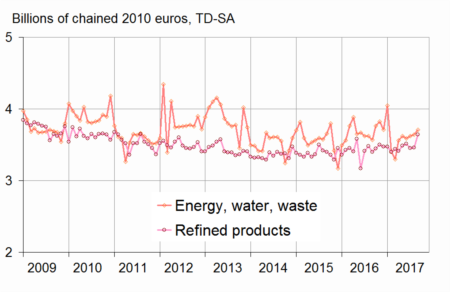
- Source: INSEE
Food products: upturn in September, decline over the quarter
In September 2017, food products purchases bounced back after a strong fall in August (+0.8% after −1.1%). This change was notably due to a recovery in meat and transformed products (canned food, condiments, etc.) consumption. Over the whole quarter, food products expenses stepped back (−0.5%) after two quarters of rise.
graphiqueGraph3 – Food products, engineered goods and energy
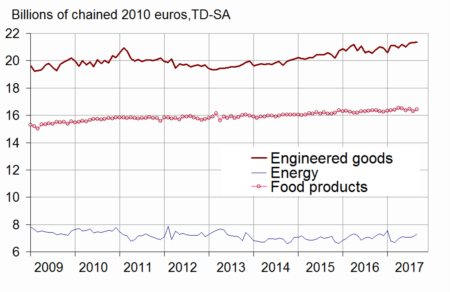
- Source: INSEE
Engineered goods: virtual stability in September, acceleration over the quarter
In September 2017, purchases of engineered goods were virtually stable. However, they remained dynamic over the whole quarter (+1.3% after +0.5%), especially regarding household durables and textile-clothing. In 2017, the sale season started a little bit later than in the previous years, which presumably bolstered the consumption in Q3.
Durables: very slight increase in September, acceleration over the quarter
In September, purchases of durables increased marginally (+0.2%): the rebound in household durables compensated the decline in transport equipment. Over the whole quarter, expenses on durables accelerated (+1.5% after +1.1%), partly due to audiovisual equipments purchases.
Textile-clothing: increasing again in September, bouncing over the quarter
In September, expenses on textile-clothing increased for the third consecutive month. Purchases of clothing and shoes increased, while textile expenditure declined. Over the whole quarter, expenses recovered (+1.8% after two slightly declining quarters).
Other engineered goods: fall in September, rebound over the quarter
In September, expenses on “other engineered goods” decreased (−0.5%) after four consecutive months of growth. This is mainly due to the decline in beauty products and perfume's purchases. Over the whole quarter, expenses bounced back (+0.7% after −0.1%).
graphiqueGraph4 – Breakdown of engineered goods
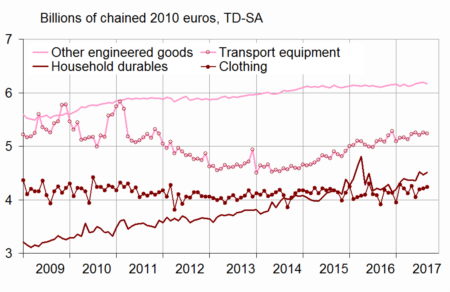
- Source: INSEE
The variation in August 2017 is slightly revised upwards
Compared to the previous estimate, the variation in household expenditure on goods in August 2017 is slightly revised upwards: −0.2% instead of −0.3%. Since the previous publication, new information has been integrated and the seasonal adjustment coefficients have been updated.
tableauTable – Household consumption expenditure on goods
| Weight (1) | July 2017 | Aug. 2017 | Sept. 2017 | Sept. 17 /Sept. 16 | Q3/Q2 | |
|---|---|---|---|---|---|---|
| Food products | 38 | 0.5 | –1.1 | 0.8 | 0.4 | –0.5 |
| - excl. Tobacco | 35 | 0.7 | –1.1 | 0.9 | 0.9 | –0.5 |
| Engineered goods | 45 | 1.2 | 0.2 | 0.1 | 4.0 | 1.3 |
| - Durables | 22 | 0.9 | 0.1 | 0.2 | 3.9 | 1.5 |
| Including: | ||||||
| - Transport equipment | 12 | –0.8 | 0.8 | –0.3 | 2.3 | 0.6 |
| - Household durables | 7 | 3.8 | –1.2 | 1.1 | 7.9 | 3.2 |
| - Textile-clothing | 9 | 3.6 | 0.5 | 0.7 | 8.4 | 1.8 |
| - Other engineered goods | 13 | 0.2 | 0.2 | –0.5 | 1.1 | 0.7 |
| Energy | 17 | –0.3 | 0.4 | 3.3 | 5.2 | 1.6 |
| - Energy. water. waste | 10 | 0.9 | 0.5 | 1.9 | 3.9 | 1.9 |
| - Refined Products | 7 | –1.8 | 0.3 | 5.1 | 7.1 | 1.3 |
| Total | 100 | 0.7 | –0.2 | 0.9 | 2.8 | 0.7 |
| - Including Manufactured goods | 84 | 0.7 | –0.2 | 0.8 | 2.9 | 0.7 |
- (1) Weighting in the consumption expenditure on goods in value in 2016
Documentation
Methodology (pdf,23 Ko)