

 27 October 2017
2017- n° 285In September 2017, agricultural prices rose by 0.6% over one year Indices of agricultural prices - September 2017
27 October 2017
2017- n° 285In September 2017, agricultural prices rose by 0.6% over one year Indices of agricultural prices - September 2017
In September 2017, agricultural products prices slowed down : +0.6% over one year after +1,7% in August. Excluding fruit and vegetables, they increased slightly over one year (+0.3%) and went down by 1.4% over one month.
In September 2017, agricultural products prices slowed down : +0.6% over one year after +1,7% in August. Excluding fruit and vegetables, they increased slightly over one year (+0.3%) and went down by 1.4% over one month.
Weaker decline in cereal prices
In September 2017, overall cereal prices continued to decline (−0.5% over one month after −4.2%). Soft wheat prices fell less strongly than the previous month (−0.5% after −5.8 %). The abundant global supply of soft wheat met with a dynamic demand as markets questionned about Russia's export capacity. Grain maïze prices are almost unchanged (+0,1%). Oilseed prices decreased again (−1.1%). Especially rapeseeds prices faltered (−0.4% after +0.7 %), under the impact of the announcement of EU tax duties cuts on Argentine biodiesel imports.
graphiqueGraph1 – Producer prices of cereals
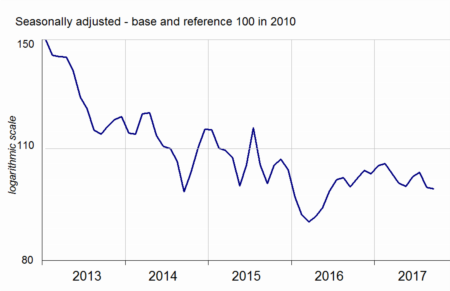
- Source: INSEE
Huge drop in potatoes prices
In September 2017, potatoes prices decreased by 34.0 % over a year, due to the sharp decline of the first ware potatoes prices of the 2017-2018 season. Fresh fruit prices rose 4.0% over a year, driven by higher prices for apples (+5.7%) and grapes (+19.0%). Prices for fresh vegetables picked up (+2.5% over a year) following the seasonal products prices rise.
graphiqueGraph2 – Producer prices of fresh vegetables
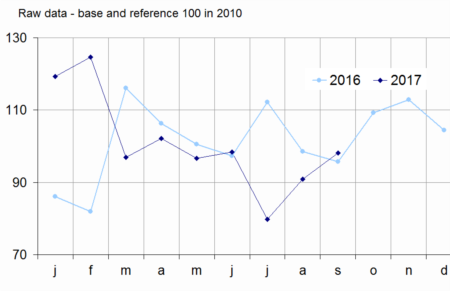
- Source: SSP (ministry in charge of agriculture)
Pig prices down, cattle prices up
The price of animals kept on decreasing in September (−0.6% over a month). Pig prices decline accelerated : −6.3% over one month and −10.3% over one year. The reduction of export opportunities, the weakness of domestic demand and the competition between european producers dragged prices down. By contrast, cattle prices continue to rise (+1.6%, +8.2% over a year). They are back to their levels of 2015 fall.
graphiqueGraph3 – Producer prices of pigs and large cattle
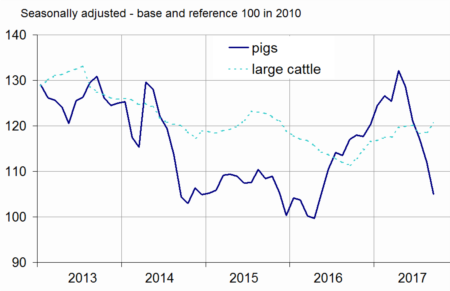
- Source: INSEE
Soaring egg prices
Eggs of French origin are still very much in demand, due to the crisis of Fipronil. Their prices surged by 23.0% over one month (+ 32.8% over one year). The price of cow's milk rose by 18.0% over one year in August, in line with the strong global demand for butter.
tableautable1 – Indice of producer prices of agricultural products (IPPAP)
| Variation as % over | |||||
|---|---|---|---|---|---|
| Weights | Sept 2017 | a month | 3 months | a year | |
| Agricultural goods output | 1000 | 114.0 | /// | /// | +0.6 |
| excluding fruits and vegetables | 900 | 114.7 | –1.4 | –2.4 | +0.3 |
| Crop output (excluding fruits and vegetables) | 505 | 116.0 | –2.8 | –3.7 | –4.1 |
| Cereals | 188 | 98.0 | –0.5 | –3.4 | –0.6 |
| of which soft wheat | 112 | 94.7 | –0.5 | –4.6 | –2.3 |
| grain maize | 41 | 92.0 | +0.1 | –6.8 | –2.9 |
| Potatoes | 26 | 166.0 | /// | /// | –34.0 |
| Wines | 177 | 135.8 | +1.9 | +0.8 | +0.5 |
| protected designation of origin | 84 | 152.0 | +3.9 | +2.8 | +3.0 |
| other wines | 23 | 125.7 | –1.9 | –5.6 | –8.0 |
| Oleaginous | 49 | 94.9 | –1.1 | –0.5 | –5.9 |
| Horticultural products | 30 | 109.6 | –0.5 | –0.7 | –0.5 |
| Other crop products | 36 | 109.6 | –0.5 | –1.0 | +0.5 |
| Fruits and vegetables (1) | 100 | 107.6 | /// | /// | +2.8 |
| Fresh vegetables | 53 | 98.1 | /// | /// | +2.5 |
| Fresh fruits | 35 | 121.5 | /// | /// | +4.0 |
| Animal output | 395 | 113.0 | +0.6 | –0.8 | +6.7 |
| Animals | 234 | 112.4 | –0.6 | –3.3 | +0.8 |
| of which large cattle | 96 | 120.5 | +1.6 | +0.4 | +8.2 |
| calves | 26 | 102.4 | +3.6 | –0.5 | –0.2 |
| pigs | 54 | 105.0 | –6.3 | –13.2 | –10.3 |
| sheep | 10 | 118.3 | –3.1 | –3.0 | +0.8 |
| poultry | 46 | 109.0 | –0.1 | 0.0 | –0.3 |
| of which chicken | 28 | 109.0 | 0.0 | 0.0 | +0.2 |
| Milk | 147 | 109.7 | /// | +1.4 | +14.4 |
| of which cow milk (2) | 137 | 109.5 | /// | +1.5 | +15.6 |
| Eggs | 15 | 155.8 | +23.0 | +15.5 | +32.8 |
- * cf. methodological note
- /// Absence of meaning due to the nature of these series
- (1) Including vegetables for industry.
- (2) The July value of cow milk price indice has been carried forward in August.
- Sources: INSEE, SSP (ministry in charge of agriculture)
Purchase prices of means of production went up slightly over a month
Intermediate consumption prices accelerated (+0.5% in September after +0.2% in August). They are 1.1% above their September 2016 level. This new rise came mainly from energy prices (+3.1% over one month) and fertilisers and soil improvers (+1.3%). However, animal feed decreased again (−0.5%). Capital goods prices were almost stable over one month (+0.1%) and increased by 2.1% year-on-year.
Revision
The variation over one year of IPPAP has been reduced by 0.2 points in August to +1.7%; that of IPAMPA has been rosen by 0.2 points to +0.2%.
graphiqueGraph4 – Purchase prices of the means of agricultural production
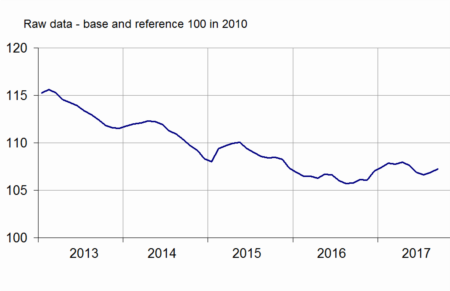
- Sources: INSEE, SSP (ministry in charge of agriculture)
tableautable2 – Indices of purchase prices of the means of agricultural production (IPAMPA)
| Variation as % over | |||||
|---|---|---|---|---|---|
| Weights | Sept 2017 | a month | 3 months | a year | |
| Total input | 1000 | 107.2 | +0.3 | +0.3 | +1.3 |
| Intermediate consumptions | 764 | 106.5 | +0.5 | +0.4 | +1.1 |
| Energy | 100 | 99.8 | +3.1 | +6.1 | +8.7 |
| Seeds | 57 | 106.4 | +0.2 | +0.1 | –1.5 |
| Fertilisers and soil improvers | 92 | 98.7 | +1.3 | –0.7 | +0.9 |
| Plant protection products | 78 | 98.1 | +0.2 | –0.2 | –1.1 |
| Animal feed | 205 | 112.1 | –0.5 | –1.0 | –0.2 |
| Veterinary expenses | 43 | 120.1 | +0.3 | +0.7 | +1.3 |
| Small equipment and tools | 17 | 107.5 | –0.5 | +0.4 | –1.6 |
| Maintenance of materials | 67 | 116.1 | +0.2 | +0.4 | +2.1 |
| Maintenance of buildings | 9 | 108.9 | 0.0 | +0.3 | +1.8 |
| Other goods and services | 97 | 102.5 | –0.1 | –0.1 | +0.4 |
| Goods and services contributing to investment | 236 | 109.6 | +0.1 | +0.1 | +2.1 |
| Material | 186 | 110.6 | +0.1 | 0.0 | +2.0 |
| Tractors | 79 | 112.8 | +0.1 | –0.1 | +3.8 |
| Machinery and equipment for cultivation | 36 | 111.8 | 0.0 | 0.0 | +0.7 |
| Machinery and equipment for harvesting | 42 | 109.3 | 0.0 | –0.1 | +0.8 |
| Utility vehicles | 18 | 104.4 | –0.4 | +0.2 | +0.2 |
| Buildings | 50 | 105.9 | 0.0 | +0.3 | +2.8 |
- (1) The repayment of the domestic tax on energy product (TICPE) benefiting farmers has been applied in advance for the year 2017.
- Sources: INSEE, SSP (ministry in charge of agriculture)
Documentation
Methodology (pdf,122 Ko)
Pour en savoir plus
Time series : Indices of agricultural prices