

 27 October 2017
2017- n° 287In August 2017, the sales volume in overall trade recovered (+0.9%) Sales volume in wholesale and retail trade - August 2017
27 October 2017
2017- n° 287In August 2017, the sales volume in overall trade recovered (+0.9%) Sales volume in wholesale and retail trade - August 2017
In August 2017, the sales volume in overall trade recovered (+0.9%) after a slight decrease in July (–0.2%). It bounced back in wholesale trade (+0.9% after −0.5%) and in trade and repair of motor vehicles and motorcycles (+1.8% after −0.8%). It rose again in retail trade (+0.4% after +0.4%)

The commentary shows variations of subsections by decreasing contribution to the overall variation. The contribution of a subsection depends on the extent of the change and on its weight.
In August 2017, the sales volume in overall trade recovered (+0.9%) after a slight decrease in July (–0.2%). It bounced back in wholesale trade (+0.9% after −0.5%) and in trade and repair of motor vehicles and motorcycles (+1.8% after −0.8%). It rose again in retail trade (+0.4% after +0.4%)
The sales volume in overall trade rose by 1.2% over the last three months
Over the last three months (June to August), the sales volume in overall trade went up by 1.2% compared to the previous three months. It rose sharply in wholesale trade (+1.6%) and in retail trade and repair of motor vehicles and motorcycles (+1.9%). It went up more moderately in retail trade (+0.4%) – it increased by 5.1% in retail trade not in stores and by 0.2% in specialised stores while it flattened out in non-specialised stores (−0.1%).
The sales volume rose by 4.7% over a year
Over the last three months, the sales volume in overall trade grew by 4.7% year on year. It increased markedly in all sectors. It rose significantly in wholesale trade (+4.5%). It also rose sharply in retail trade (+3.6%) – it grew in specialised stores (+3.8%) and non-specialised stores (+2.2%) as well as in retail trade not in stores (+9.4%). It went up substantially in trade and repair of motor vehicles and motorcycles (+8.1%).
graphiqueGraph1 – Sales volume in wholesale and retail trade; repair of motor vehicles and motorcycles
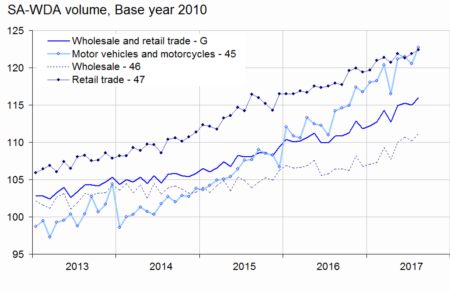
- Sources: DGFiP, INSEE
tableauTable1 – Sales volume in retail trade; repair of motor vehicles and motorcycles
| Change in % | |||||
|---|---|---|---|---|---|
| NACE Classification | Weight | Aug./ July | July/ June | q-o-q (1) | y-o-y (2) |
| G Wholesale and retail trade ; repair of motor vehicles and motorcycles | 10000 | 0.9 | –0.2 | 1.2 | 4.7 |
| 45 Wholesale and retail trade and repair of motor vehicles and motorcycles | 1248 | 1.8 | –0.8 | 1.9 | 8.1 |
| 46 Wholesale trade, except of motor vehicles and motorcycles | 5748 | 0.9 | –0.5 | 1.6 | 4.5 |
| 47 Retail trade, except of motor vehicles and motorcycles | 3004 | 0.4 | 0.4 | 0.4 | 3.6 |
| 471 Retail sale in non- specialised stores | 1112 | 0.1 | –0.6 | –0.1 | 2.2 |
| 472 to 477 Retail sale in specialised stores | 1718 | 0.4 | 1.0 | 0.2 | 3.8 |
| 478 and 479 Retail trade not in stores | 174 | 2.0 | 1.6 | 5.1 | 9.4 |
- (1) Quarter-on-quarter: last three months /previous three months.
- (2) Year-on-year: last three months / same three months of the previous year.
- The codes correspond to different levels of aggregation of the classification NAF rev.2
- Sources: DGFiP, INSEE
Rebound in wholesale trade
In August 2017, the sales volume in whosesale trade recovered (+0.9% after –0.5% in July). It gathered pace in wholesale of agricultural raw materials and live animals (+6.7% after +2.7%). After a stability in July, it bounced back in wholesale of other machinery, equipment and supplies (+1.8%). It rebounded in wholesale of household goods (+0.8% after −1.6%) and in wholesale on a fee or contract basis (+0.9% after −1.8%). By contrast, the sales volume fell back in information and communication equipment (−1.0% after +0.6%) and in other non specialised wholesale (−0.7% after +0.8%).
Sharp rebound in sales volume of trade and repair of motor vehicles and motorcycles
In August 2017, the sales volume in trade and repair of motor vehicles and motorcycles recovered (+1.8% after −0.8% in July). This increase was due to a sharp rebound in sale of motor vehicle (+2.7% after −1.3%), in maintenance and repair of motor vehicles (+3.2% after −1.4%) and in sale and repair of motorcycles (+3.7% after −3.6%). Conversely, the sales volume of motor vehicle parts and accessories fell back (−0,7% after +0.7%).
Further increase in sales volume of retail trade
In August 2017, the sales volume in retail trade rose again moderately (+0.4%, the same as in July). In specialised stores, the sales volume slowed down (+0.4% after +1.0%) even though it recovered sharply in retail sale of food, beverages and tobacco (+4.4% after −4.1%) and grew markedly in cultural and recreation goods (+1.8% after +1.4%). In fact, the sales volume in retail sale of other goods flattened out (+0.1% after +1.7%). Besides, it fell back in retail of automotive fuel (−1.7% after +1.0%) and in retail sale of information and communication equipment (−0.5% after +3.3%). The sales volume in retail trade not in stores rose sharply (+2.0% after +1.6%).
According to the first early estimates, the sales volume in retail trade except of motor vehicles and motorcycles should increase in September 2017 (+1.2%). It should grow by 4,2% year on year.
Revisions
The variation in the sales volume of overall trade in July 2017 has been revised upwards. Initially stated at −0.4%, it has been set at −0.2% (rounded number).
tableauTable2 – Sales volume in retail trade; repair of motor vehicles and motorcycles
| Change in % | |||||
|---|---|---|---|---|---|
| Nace Classification | Weight | Aug. 2017 | Aug./ July | July/ June | q-o-q (1) |
| G Wolesale and retail trade; repair of motor vehicles and motorcycles | 10000 | 116.0 | 0.9 | –0.2 | 1.2 |
| 45 Wholesale and retail trade and repair of motor vehicles and moto. | 1248 | 122.7 | 1.8 | –0.8 | 1.9 |
| 451 Sale of motor vehicles | 837 | 118.9 | 2.7 | –1.3 | 1.7 |
| 452 Maintenance and repair of motor vehicles | 97 | 110.7 | 3.2 | –1.4 | 0.6 |
| 453 Sale of motor vehicle parts and accessories | 283 | 140.9 | –0.7 | 0.7 | 2.8 |
| 454 Sale, maintenance and repair of moto. and related parts and accessories | 31 | 97.2 | 3.7 | –3.6 | 1.0 |
| 46 Wholesale trade, except of motor vehicles and moto. | 5748 | 111.2 | 0.9 | –0.5 | 1.6 |
| 461 Wholesale on a fee or contract basis | 869 | 122.5 | 0.9 | –1.8 | 1.3 |
| 462 Wholesale of agricultural raw materials and live animals | 319 | 102.4 | 6.7 | 2.7 | 3.1 |
| 463 Wholesale of food, beverages and tobacco | 992 | 108.0 | 0.7 | –1.3 | 0.0 |
| 464 Wholesale of household goods | 1196 | 116.2 | 0.8 | –1.6 | 2.2 |
| 465 Wholesale of information and communication equipment | 349 | 125.2 | –1.0 | 0.6 | 3.6 |
| 466 Wholesale of other machinery, equipment and supplies | 721 | 113.0 | 1.8 | 0.0 | 1.4 |
| 467 Other specialised wholesale | 1138 | 95.1 | –0.1 | 1.4 | 0.9 |
| 469 Non specialised wholesale trade | 164 | 125.3 | –0.7 | 0.8 | 4.3 |
| 47 Retail trade, except of motor vehicles and moto. | 3004 | 122.4 | 0.4 | 0.4 | 0.4 |
| 471 Non-specialised stores | 1112 | 113.3 | 0.1 | –0.6 | –0.1 |
| 472 to 477 Specialised stores | 1718 | 125.5 | 0.4 | 1.0 | 0.2 |
| 472 Retail sale of food, beverages and tobacco | 144 | 139.4 | 4.4 | –4.1 | –1.0 |
| 473 Retail sale of automotive fuel | 231 | 95.5 | –1.7 | 1.0 | 0.3 |
| 474 Retail sale of information and communication equipment | 84 | 195.4 | –0.5 | 3.3 | 3.2 |
| 475 Retail sale of other household equipment | 338 | 107.9 | 0.6 | 0.3 | 0.7 |
| 476 Retail sale of cultural and recreation goods | 143 | 112.6 | 1.8 | 1.4 | 0.6 |
| 477 Retail sale of other goods | 778 | 134.4 | 0.1 | 1.7 | –0.3 |
| 478 et 479 Retail trade not in stores | 174 | 149.4 | 2.0 | 1.6 | 5.1 |
- (1) Quarter-on-quarter: last three months /previous three months.
- Sources: DGFiP, INSEE
tableauTable3 – Revision of variations
| July/ June | June/ May | May/ Apr | Q2 2017/ Q1 2017 | 2016/ 2015 | |
|---|---|---|---|---|---|
| G Overall trade | 0.14 | 0.12 | 0.00 | 0.07 | 0.01 |
| Raw series | 0.21 | 0.06 | –0.02 | 0.02 | 0.00 |
| SA-WDA parameters | –0.07 | 0.06 | 0.02 | 0.05 | 0.01 |
- How to read: in the wholesale and retail trade; repair of motor vehicles and motorcycles, the SA-WDA variation between June and July 2017 is revised upwards by 0.14 points, 0.21 points due to the revision of raw data, −0.07 points to the update of SA-WDA parameters
- Sources: DGFiP, INSEE