

 28 April 2017
2017- n° 117Household consumption expenditure on goods receded again in March 2017 (−0.4%) and
fell by 0.4% over the first quarter 2017 Household consumption expenditure on goods - March 2017
28 April 2017
2017- n° 117Household consumption expenditure on goods receded again in March 2017 (−0.4%) and
fell by 0.4% over the first quarter 2017 Household consumption expenditure on goods - March 2017
In March 2017, household consumption expenditure on goods decreased in volume* (−0.4%), after an already sharp decline in the previous month (−0.7%). Over the whole first quarter, it retreated by 0.4%, after a +0.9% rise over the fourth quarter of 2016. In March as well as over the whole quarter, the fall in energy consumption weighed on the overall expenditure.
- Energy: decreasing again in March, stepping back sharply over the quarter
- Engineered goods: near stability in March, moderate growth over the first quarter
- Durables: slowdown in March
- Textile-clothing: decreasing over the month
- Other engineered goods: speeding up over the quarter
- Food products: slight fall in March and moderate rise over the quarter
- The variation in February 2017 is revised upwards
In March 2017, household consumption expenditure on goods decreased in volume* (−0.4%), after an already sharp decline in the previous month (−0.7%). Over the whole first quarter, it retreated by 0.4%, after a +0.9% rise over the fourth quarter of 2016. In March as well as over the whole quarter, the fall in energy consumption weighed on the overall expenditure.

*Volumes are measured at chain-link previous year prices (2010 euro billions) and all figures are trading-day and seasonally adjusted.
graphiqueGraph1 – Total consumption of goods
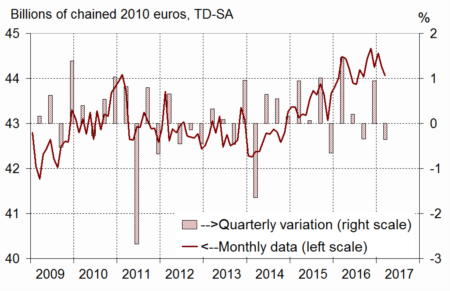
- Source: INSEE
Energy: decreasing again in March, stepping back sharply over the quarter
In March 2017, energy consumption kept on declining (−1.8%), though at a far slower pace than in February (−10.9%). A slight rebound in purchases of refined products (+0.5%), notably in fuel, partially offset a further drop in expenses on gas and electricity, as a result of temperatures still above seasonal norms. Over the whole quarter, the particularly mild temperatures at the end of winter reduced household energy consumption (−3.8%).
graphiqueGraph2 – Breakdown of energy
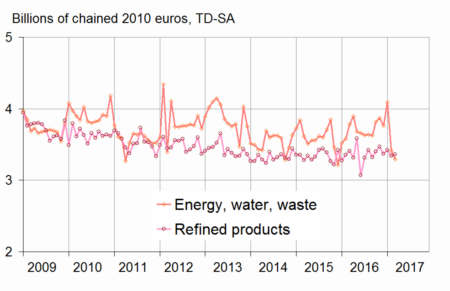
- Source: INSEE
Engineered goods: near stability in March, moderate growth over the first quarter
In March 2017, purchases of engineered goods were almost unchanged (−0.1%). Over the quarter, they increased moderately (+0.4% after +1.0%).
Durables: slowdown in March
In March, expenses on durables slowed down (+0.4% after +1.5%), in particular in household durables. Purchases of new vehicles increased moderately again. Over the whole quarter, consumption of durables was stable, buoyed by expenditure on household durables (+1.3%) but hampered by lower spending on automobiles (−0.4%).
Textile-clothing: decreasing over the month
In March, expenses on textile-clothing fell back after a sharp recovery in February. Over the whole quarter, spending sped up (+0.9% after +0.3%).
Other engineered goods: speeding up over the quarter
In March, expenses on other engineered goods picked up slightly (+0.4% after −0,1%). Over the whole quarter, purchases accelerated (+0.9% after 0.5% over the fourth quarter of 2016), in particular those of DIY materials.
graphiqueGraph3 – Breakdown of engineered goods
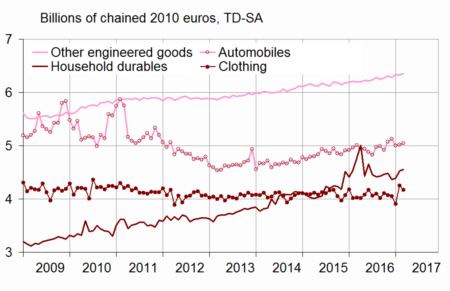
- Source: INSEE
Food products: slight fall in March and moderate rise over the quarter
In March, consumption of food products edged down (−0.3% after +0.5%), notably due to tobacco consumption. Over the whole quarter, spending on food products picked up slightly (+0.3% after −0.3%), particularly on agrifood products.
graphiqueGraph4 – Food products, engineered goods and energy
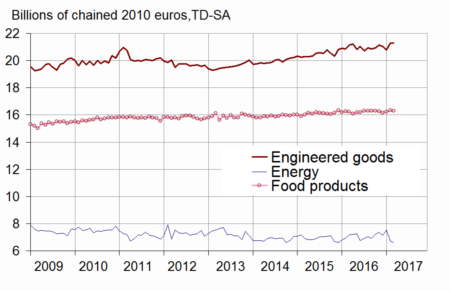
- Source: INSEE
The variation in February 2017 is revised upwards
The variation in household expenditure on goods in February 2017 is revised upwards by 0.1 points (−0.7% instead of −0.8%). Since the previous publication, new information has been integrated, especially in households durables and the seasonal adjustment coefficients have been updated.
tableauTable – Household consumption expenditure on goods
| Weight (1) | Jan. 2017 | Feb. 2017 | Mar. 2017 | Mar. 17 / Mar. 16 | Q1 2017 / Q4 2016 | |
|---|---|---|---|---|---|---|
| Food products | 38 | 0.6 | 0.5 | –0.3 | 0.3 | 0.3 |
| Engineered goods | 45 | –1.2 | 2.5 | –0.1 | 0.7 | 0.4 |
| - Durables | 22 | –1.4 | 1.5 | 0.4 | –1.4 | 0.0 |
| Including : | ||||||
| - Automobiles | 12 | –2.6 | 0.4 | 0.4 | 0.6 | –0.4 |
| - Household durables | 8 | 0.7 | 3.2 | 0.5 | –4.7 | 1.3 |
| - Textile-clothing | 9 | –3.4 | 8.7 | –1.9 | 3.5 | 0.9 |
| - Other engineered goods | 13 | 0.9 | –0.1 | 0.4 | 2.4 | 0.9 |
| Energy | 17 | 5.8 | –10.9 | –1.8 | –8.2 | –3.8 |
| - Energy. water. waste | 10 | 8.8 | –16.5 | –3.7 | –12.9 | –5.7 |
| - Refined Products | 7 | 1.6 | –2.4 | 0.5 | –1.5 | –1.2 |
| Total | 100 | 0.7 | –0.7 | –0.4 | –1.0 | –0.4 |
| - Including Manufactured goods | 84 | –0.2 | 1.4 | –0.3 | 0.6 | 0.4 |
- (1) Weighting in the consumption expenditure on goods in value in 2016
- Source: INSEE
Documentation
Methodology (pdf,23 Ko)