

 20 December 2016
2016- n° 334In September 2016, producer costs for construction increased slighlty (+0.2%) Costs of production indices in construction - September 2016
20 December 2016
2016- n° 334In September 2016, producer costs for construction increased slighlty (+0.2%) Costs of production indices in construction - September 2016
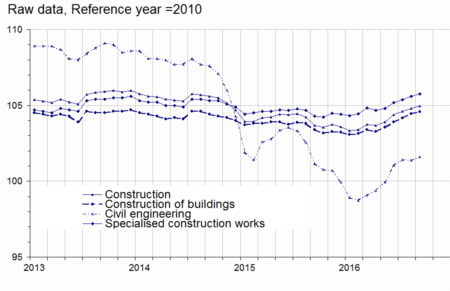
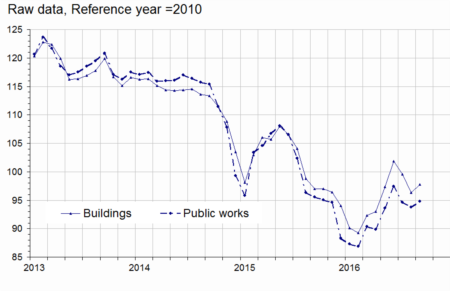
In September 2016, producer costs in construction increased slighlty (+0.2% as in the last two months). They rose somewhat in the construction of buildings (+0.2% after +0.3%) like in civil engineering (+0.2% after 0.0%) and they were virtually stable in specialised construction works (+0.1% after +0.2%). Over a year, producer costs accelerated in the entire construction sector (+1.3 % after +0.6%). This trend held for building construction (+1.2% after +0.6%) as well as for specialised construction works (+1.3% after +0.9%). Producer costs recovered in civil engineering, the first increase since the end of 2012 (a year-on-year rise of 0.4%).
In September 2016, producer costs in construction increased slighlty (+0.2% as in the last two months). They rose somewhat in the construction of buildings (+0.2% after +0.3%) like in civil engineering (+0.2% after 0.0%) and they were virtually stable in specialised construction works (+0.1% after +0.2%). Over a year, producer costs accelerated in the entire construction sector (+1.3 % after +0.6%). This trend held for building construction (+1.2% after +0.6%) as well as for specialised construction works (+1.3% after +0.9%). Producer costs recovered in civil engineering, the first increase since the end of 2012 (a year-on-year rise of 0.4%).
tableauTable1 – Variations in producer cost indices for construction
| NAF | Heading | Weights (in %) | Sep. 16/ Aug. 16 | Sep. 16/ Sep. 15 |
|---|---|---|---|---|
| F | Construction | 100.0 | +0.2 | +1.3 |
| 41.2 | Construction of buildings | 10.1 | +0.2 | +1.2 |
| 42 | Civil engineering | 16.2 | +0.2 | +0.4 |
| 43 | Specialised construction works | 73.7 | +0.1 | +1.3 |
| 43BT | Buildings | 64.2 | +0.2 | +1.5 |
| 43BTC | New buildings | 24.6 | +0.2 | +1.3 |
| 43BTR | Existing buildings | 39.6 | +0.1 | +1.7 |
| 43TP | Specialised works for civil engineering | 9.5 | +0.2 | +0.7 |
| BT | Buildings (41.2 + 43BT) | 74.3 | +0.1 | +1.4 |
| TP | Public works (42 + 43TP) | 25.7 | +0.2 | +0.5 |
- Source: INSEE
tableauTable2 – Items of producer cost indices for construction
| Costs | items | Q3 16 / Q2 16 | Sep. 16/ Aug. 16 | Sep. 16/ Sep. 15 | |
|---|---|---|---|---|---|
| Equipment | Buildings | -0.3 | +0.3 | +0.4 | |
| Public works | -0.2 | 0.0 | -0.6 | ||
| Labour | Labour costs in construction | +1.0 | /// | /// | |
| Energy | Buildings | +0.5 | +1.6 | +0.8 | |
| Public works | +0.9 | +1.1 | -0.7 | ||
| Materials | Construction of buildings | +1.4 | +0.1 | -0.9 | |
| Existing buildings | +0.6 | -0.1 | -0.7 | ||
| Civil engineering | +3.5 | +0.3 | -1.6 | ||
| Specialised works for civil engineering | +0.3 | +0.1 | -1.2 | ||
| Services | Construction | +0.9 | -1.1 | +0.6 | |
| Transport | Buildings | +0.2 | +0.3 | +0.7 | |
| Public works | -0.3 | 0.0 | +1.3 | ||
- ///: non published estimation
- Source: INSEE
graphiqueGraph1 – Production costs in construction
- Source: INSEE
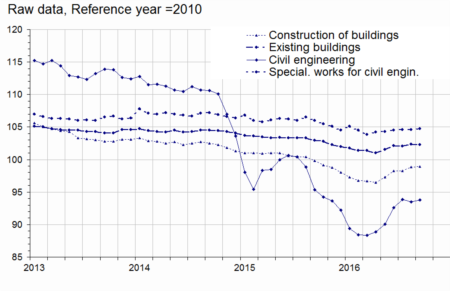
Material costs were virtually stable in the construction of buildings
In September 2016, material costs were virtually stable in building construction (+0.1% after +0.5%) and in specialised works for civil engineering (+0.1% after 0.0%). They rebounded in civil engineering (+0.3% after −0.3%). Over a year, material costs still decreased in all sectors : in the construction of buildings (−0.9%) as well as in the renovation of existing buildings (−0.7%), in civil engineering (−1.6%) and in specialised works for civil engineering (−1.2%).
graphiqueGraph2 – Materials costs
- Source: INSEE
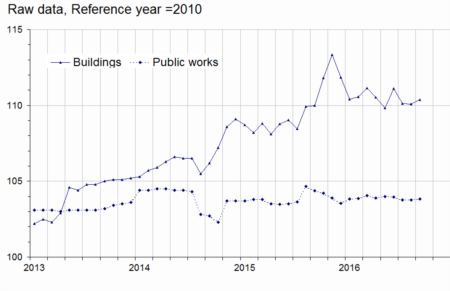
Equipment cost increased moderately
In September 2016, equipment cost increased moderately in building construction (+0.3% after a stability in August). It was unchanged in public works as in August.
graphiqueGraph3 – Equipment cost
- Source: INSEE
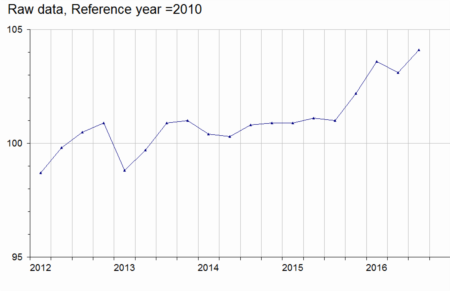
graphiqueGraph4 – Labour cost in construction
- Source: INSEE
Energy cost bounced back
In September 2016, the cost of energy increased in building construction (+1.6%) and in public works (+1.1%) following two consecutive months of decline.
Over a year, the cost of energy remained on a downward trend in public works (−0.7% after −2.6%). In building construction, it was higher than a year ago (+0.8%) for the first time since the end of 2012.
graphiqueGraph5 – Energy cost
- Source: INSEE
tableauTable3 – Variations' revisions
| June 16 | July 16 | August 16 | ||
|---|---|---|---|---|
| F | Construction | /// | +0.1 | +0.1 |
| 41.2 | Construction of buildings | /// | +0.1 | +0.1 |
| 42 | Civil engineering | -0.1 | +0.1 | +0.1 |
| 43 | Specialised construction works | /// | +0.1 | +0.1 |
- ///: unchanged
- How to read it: the variation in producer cost for construction in August 2016 has been revised upward by 0.1 points, from +0.1% published in November 2016 to +0.2%.
- Source: INSEE
Pour en savoir plus
Time series : Producer cost indices for construction