

 22 September 2016
2016- n° 248In September 2016, the business climate improves slightly in services Monthly survey of services - September 2016
22 September 2016
2016- n° 248In September 2016, the business climate improves slightly in services Monthly survey of services - September 2016
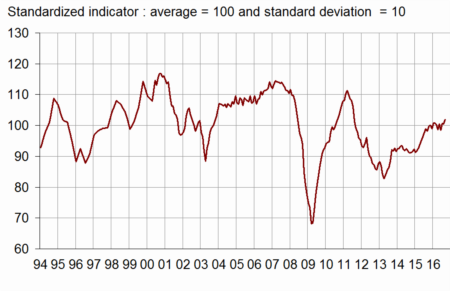
According to business managers surveyed in September 2016, the business climate in services has improved slightly. The business climate composite indicator has increased by one point and has reached 102, slightly above its long-term average (100).
- More favourable business and demand prospects
- The business climate is virtually stable in road transport
- In accomodation and food service activities, the business climate has recovered but remains below its long-term average
- The business climate has improved again in information and communication
- The business climate in real estate activities is almost unchanged
- In professional, scientific and technical activities, the business climate has slipped back to its long-term average
- The business climate in administrative and support service activities is almost stable, slightly above its long-term average
According to business managers surveyed in September 2016, the business climate in services has improved slightly. The business climate composite indicator has increased by one point and has reached 102, slightly above its long-term average (100).
graphiqueGraph1 – Business climate composite indicator
The turning point indicator is in the uncertainty area.
graphiquegraph_retourn – Turning point indicator
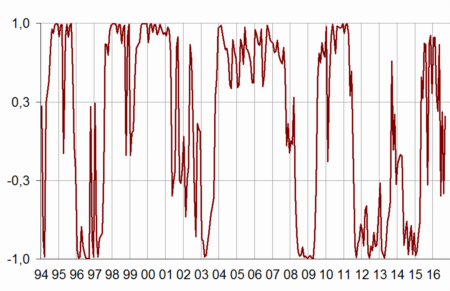
- Note: close to 1 (respectively −1), this indicator indicates a favourable short-term economic situation (respectively unfavourable). Between +0.3 and −0.3: uncertainty area.
More favourable business and demand prospects
The balance of opinion on past activity has decreased, deviating further from its long-term average. However, the balances on expected activity and demand have improved, and have returned slightly above their long-term average.
The balance on general outlook, which relates the assessment of business leaders over their whole sector, is almost unchanged, close to its long-term average.
Fewer business managers expect a decrease in prices in the coming months. The corresponding balance has returned to its long-term average.
The balances on employment are stable or virtually stable, far above their long-term average. The balance on expected employment has rebounded in services except temporary work agencies and has come back above its long-term average.
The balance on past investments has increased slightly, whereas that on expected investments has gone down slightly. Both balances stand above their long-term average.
tableauTable_month – Economic outlook in the services sector
| Average* | June 16 | July 16 | Aug. 16 | Sept. 16 | |
|---|---|---|---|---|---|
| Composite indicator | 100 | 98 | 101 | 101 | 102 |
| General outlook | –8 | –8 | –6 | –8 | –7 |
| Past activity | 2 | 0 | –2 | 0 | –3 |
| Expected activity | 2 | –3 | 1 | 1 | 3 |
| Expected demand | –1 | –2 | –1 | –1 | 2 |
| Past selling prices | –4 | –9 | –8 | –4 | –3 |
| Expected selling prices | –3 | –7 | –5 | –6 | –3 |
| Past employment | 3 | 8 | 9 | 8 | 8 |
| except temporary work agencies | 1 | 2 | 3 | 2 | 2 |
| Expected employment | 2 | 4 | 9 | 10 | 11 |
| except temporary work agencies | –1 | –1 | 4 | –1 | 5 |
| Investments | |||||
| Past investments | 1 | 4 | 2 | 4 | 6 |
| Expected investments | 1 | 7 | 7 | 6 | 4 |
- * Average of the balances of opinion since 1988
- Source: INSEE, business survey in services.
In most subsectors, the business climate stands at its long-term average or slightly above. Only the business climate in accomodation and food services is clearly below its long-term average, despite having improved sharply in September after a strong decrease in August.
The business climate is virtually stable in road transport
In road transport, the business climate is practically stable. At 102, it remains above its long-term average. The balances on past activity and on general outlook have recovered but the balance on expected activity has fell back.
In accomodation and food service activities, the business climate has recovered but remains below its long-term average
In accomodation and food service activities, the business climate has increased by seven points (96) after a sharp fall in August, but it remains below its long-term average. The balances on expected activity and demand and on general outlook have recovered.
The business climate has improved again in information and communication
In information and communication, the business climate has gone up by two points again and has reached 102, slightly above its long-term average. The balances on expected demand and employment have increased markedly.
The business climate in real estate activities is almost unchanged
In real estate activities, the business climate is virtually unchanged (102). The decrease in the balance on past activity is offset by the increase in the balance on expected activity.
In professional, scientific and technical activities, the business climate has slipped back to its long-term average
The business climate in professional, scientific and technical activities has gone down by three points and has returned to its long-term average (100). The balances on expected activity and demand have fell back.
The business climate in administrative and support service activities is almost stable, slightly above its long-term average
In administrative and support service activities, the business climate is almost unchanged (102), slightly above its long-term average. The balance on past activity has gone down and stands below its long-term average. However, the expectations on activity have improved again and have returned above their long-term average. The balances on employment remain well above their long-term average.
tableauTable_det – Business climate composite indicator and balances of opinion by sub-sector in services
| Aggregated classification (NA 2008) at level A21 | Mean* | June 16 | July 16 | Aug. 16 | Sept. 16 |
|---|---|---|---|---|---|
| Road transport (8%) | |||||
| Composite indicator | 100 | 101 | 104 | 103 | 102 |
| Past activity | –8 | –13 | –9 | –3 | 0 |
| Expected activity | –9 | –9 | –3 | –4 | –10 |
| Expected demand | –13 | –9 | –1 | –6 | –8 |
| Past employment | –8 | 4 | –4 | 1 | 3 |
| Expected employment | –10 | –7 | –10 | –8 | –8 |
| General outlook | –24 | –17 | –13 | –19 | –13 |
| Accomodation and food service activities (11%) | |||||
| Composite indicator | 100 | 92 | 100 | 89 | 96 |
| Past activity | –7 | –12 | –12 | –14 | –15 |
| Expected activity | –8 | –16 | –4 | –18 | –7 |
| Expected demand | –10 | –17 | –10 | –19 | –14 |
| Past employment | –4 | –2 | 1 | –5 | –9 |
| Expected employment | –6 | –3 | 2 | –4 | 0 |
| General outlook | –14 | –25 | –20 | –31 | –23 |
| Information and communication (24%) | |||||
| Composite indicator | 100 | 98 | 98 | 100 | 102 |
| Past activity | 8 | 0 | –20 | 1 | –3 |
| Expected activity | 9 | –5 | 4 | 8 | 6 |
| Expected demand | 10 | 3 | 9 | 8 | 18 |
| Past employment | 6 | 6 | 4 | 4 | 3 |
| Expected employment | 10 | 8 | 10 | 9 | 17 |
| General outlook | 0 | –1 | –1 | 0 | –2 |
| Real estate activities (13%) | |||||
| Composite indicator | 100 | 96 | 102 | 103 | 102 |
| Past activity | 7 | 4 | 14 | 11 | 4 |
| Expected activity | 8 | 10 | 11 | 9 | 16 |
| Expected demand | 1 | –3 | 2 | 2 | –1 |
| Past employment | 3 | 2 | 1 | 10 | 6 |
| Expected employment | 2 | –2 | 4 | 1 | 7 |
| General outlook | –2 | –3 | 0 | 1 | –2 |
| Professional, scientific and technical activities (24%) | |||||
| Composite indicator | 100 | 99 | 100 | 103 | 100 |
| Past activity | –1 | –1 | 4 | –2 | –1 |
| Expected activity | –2 | –6 | –3 | 0 | –4 |
| Expected demand | –6 | –5 | –8 | –2 | –4 |
| Past employment | 1 | 2 | 3 | 1 | –3 |
| Expected employment | 0 | 0 | 4 | 4 | 7 |
| General outlook | –9 | –8 | –9 | –5 | –8 |
| Administrative and support service activities (18%) | |||||
| Composite indicator | 100 | 102 | 101 | 101 | 102 |
| Past activity | 6 | 15 | 9 | 6 | 0 |
| Expected activity | 5 | 4 | –1 | 4 | 9 |
| Expected demand | 3 | 6 | 2 | 4 | 2 |
| Past employment | 9 | 20 | 26 | 20 | 23 |
| Expected employment | 7 | 14 | 19 | 25 | 25 |
| General outlook | –5 | –4 | 0 | –5 | –4 |
- The figures in parentheses indicate the weights used to aggregate the sub-sector balances of opinion.
- *Average of the balances of opinion since 1988 (2006 for road transport)
- Source : INSEE, business survey in services.
Documentation
Methodology (2016) (pdf,158 Ko)
Pour en savoir plus
Time series : Economic outlook surveys – Services