

 21 April 2016
2016- n° 103In April 2016, the business climate is virtually stable in services Monthly survey of services - April 2016
21 April 2016
2016- n° 103In April 2016, the business climate is virtually stable in services Monthly survey of services - April 2016
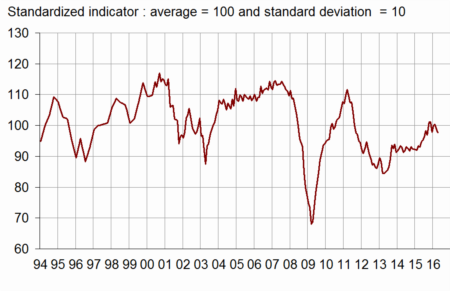
According to business managers, the business climate in services is virtually stable in April 2016. The composite indicator which measures it has decreased by one point and stands (98) slightly below its long-term average (100). The turning point indicator is in the unfavourable area.
All services
According to business managers, the business climate in services is virtually stable in April 2016. The composite indicator which measures it has decreased by one point and stands (98) slightly below its long-term average (100). The turning point indicator is in the unfavourable area.
graphiqueGraph1 – Business climate composite indicator
graphiquegraph_retourn – Turning point indicator
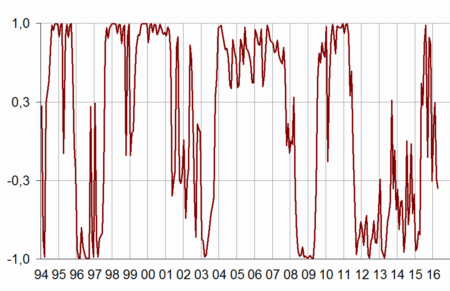
- Note: close to 1 (respectively −1), this indicator indicates a favourable short-term economic situation (respectively unfavourable). Between +0.3 and −0.3: uncertainty area.
The balance of opinion on the general outlook, which relates the assessment of business leaders over their whole sector, is almost stable, close to its long-term average. The balance on past activity has improved and has returned slightly above its long-term average. However, more business leaders than in March expect a deacrease in activity and demand for the incoming months.
The balance of opinion on the past operating balance has gone down and has fallen back below its long-term average. The balance on expected operating balance is almost stable, at its long-term average.
For the second month in a row, the balance on past employment has improved, whereas the balance on expected employment has gone down. Both balances stand above their long-term average.
tableauTable_quarter – Economic outlook in the services sector
| Average* | Jan. 16 | Feb. 16 | March 16 | April 16 | |
|---|---|---|---|---|---|
| Composite indicator | 100 | 100 | 100 | 99 | 98 |
| General outlook | −8 | −4 | −8 | −8 | −9 |
| Past activity | 2 | −2 | 0 | −1 | 3 |
| Expected activity | 2 | −1 | 0 | −1 | −3 |
| Expected demand | −1 | −1 | 1 | −2 | −5 |
| Past selling prices | −4 | −7 | −10 | −9 | −11 |
| Expected selling prices | −3 | −12 | −4 | −4 | −5 |
| Past employment | 3 | 11 | 7 | 11 | 14 |
| except temporary work agencies | 1 | 4 | 3 | 7 | 4 |
| Expected employment | 2 | 8 | 11 | 9 | 6 |
| except temporary work agencies | −1 | 0 | 2 | 0 | −3 |
| Investments | |||||
| Past investments | 1 | 5 | 6 | 6 | 8 |
| Expected investments | 1 | 6 | 3 | 3 | −1 |
| Operating balance result | |||||
| Past result | −2 | 1 | −5 | ||
| Expected result | −2 | −3 | −2 | ||
| Cash position | −11 | −10 | −10 | ||
| Difficulties of supply and demand | |||||
| difficulties of supply and demand | 10 | 13 | 11 | ||
| difficulties of supply only | 22 | 19 | 22 | ||
| difficulties of demand only | 32 | 37 | 34 | ||
| Difficulties in recruitment | 27 | 21 | 20 |
- * Average of the balances of opinion since 1988
- Source: Insee
Road transport
In road freight, the balance on past activity is practically stable, at its long-term average. The balances on expected activity and demand have decreased markedly and have fallen back to their long-term average. The balances on employment remain above their long-term average.
Accommodation and food service activities
In accommodation and food service activities, the balance on past activity is virtually stable, above its long-term average. The expectations on activity have deteriorated again. The balance on expected demand remains low. However, the balances on past and expected employment remain well above their long-term average.
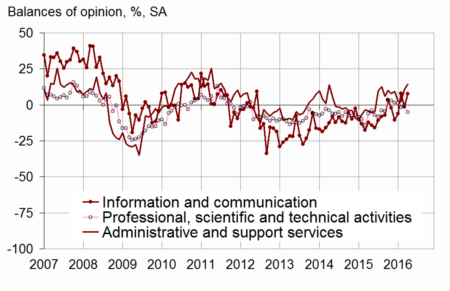
Information and communication
In information and communication, the balance on past activity has increased significantly and has returned to its long-term average. Nevertheless, the expectations on activity and demand have deteriorated markedly. The corresponding balances are clearly below their long-term average.
Real estate
In real estate, the balances on past and expected activity and on expected demand have recovered sharply. However, the balance on past employment has gone down and has fallen back below its long-term average.
Professional, scientific and technical activities
In professional, scientific and technical activities, the balance on past activity has decreased significantly and has returned below its long-term average. The expectations on activity and demand have deteriorated too and stand now below their long-term average.
Administrative and support service activities
In administrative and support service activities, the balance on past activity has improved again and stand clearly above its long-term average. The balances on expected activity and demand have decreased slightly but remain above their long-term average. The balance on past employment has improved again and the balance on expected employment is stable. Both balances stand well above their long-term average, particularly in temporary work agencies.
graphiquegraph_bonus_ – Past activity in services
tableauTable_det – Detailed data
| A21 | Average* | Jan. 16 | Feb. 16 | March 16 | April 16 |
|---|---|---|---|---|---|
| (H) Road transport | |||||
| Past activity | −8 | −2 | −8 | −7 | −8 |
| Expected activity | −9 | −5 | −5 | −1 | −9 |
| Expected demand | −13 | −11 | −10 | −5 | −13 |
| Past employment | −8 | −3 | −5 | −6 | 1 |
| Expected employment | −10 | −3 | −3 | −2 | −3 |
| (I) Accommodation and food service activities | |||||
| Past activity | −7 | −14 | −5 | 3 | 2 |
| Expected activity | −7 | 0 | 0 | −10 | −16 |
| Expected demand | −9 | −3 | −7 | −12 | −13 |
| Past employment | −3 | 2 | −5 | 4 | 15 |
| Expected employment | −5 | −7 | 7 | 7 | 1 |
| (J) Information and communication | |||||
| Past activity | 8 | −6 | 8 | −1 | 8 |
| Expected activity | 10 | 0 | 2 | 1 | −4 |
| Expected demand | 10 | 14 | 11 | 10 | −2 |
| Past employment | 6 | 10 | 12 | 4 | 6 |
| Expected employment | 10 | 8 | 7 | 5 | 8 |
| (L) Real estate activities | |||||
| Past activity | 7 | 8 | −4 | −11 | 2 |
| Expected activity | 7 | 1 | 3 | −2 | 6 |
| Expected demand | 1 | −5 | −1 | −10 | −1 |
| Past employment | 3 | 4 | 1 | 9 | −1 |
| Expected employment | 2 | 11 | 4 | 0 | 2 |
| (M) Professional, scientific and technical activities | |||||
| Past activity | −1 | 1 | −2 | 0 | −5 |
| Expected activity | −2 | −5 | −4 | −4 | −5 |
| Expected demand | −6 | −8 | −6 | −6 | −10 |
| Past employment | 1 | 1 | 4 | 8 | −1 |
| Expected employment | 0 | 1 | 2 | 0 | −3 |
| (N) Administrative and support service activities | |||||
| Past activity | 6 | 3 | 2 | 11 | 14 |
| Expected activity | 5 | 5 | 8 | 10 | 8 |
| Expected demand | 3 | 1 | 9 | 5 | 3 |
| Past employment | 8 | 26 | 18 | 21 | 35 |
| Expected employment | 7 | 24 | 25 | 21 | 21 |
- * Average of the balances of opinion since 1988 (2006 for road transport)
Documentation
Methodology (2016) (pdf,158 Ko)
Pour en savoir plus
Time series : Economic outlook surveys – Services