

 28 September 2012
2012- n° 237Households’ consumption on goods increased in July (+0.4%) then decreased in August
(–0.8%) Household consumption expenditure on goods - July-August 2012
28 September 2012
2012- n° 237Households’ consumption on goods increased in July (+0.4%) then decreased in August
(–0.8%) Household consumption expenditure on goods - July-August 2012
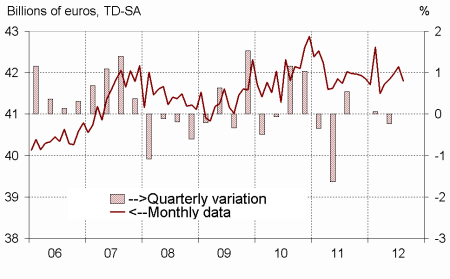
In August, the volume* of households’ expenditure on goods decreased by 0.8%, after an increase of 0.4% in July. The increase in July was mainly imputable to a bounce in purchases in textile-leather. The decrease in expenditure on petroleum products and on household durables was the main contributing factor to the decrease of consumption in August.
In August, the volume* of households’ expenditure on goods decreased by 0.8%, after an increase of 0.4% in July. The increase in July was mainly imputable to a bounce in purchases in textile-leather. The decrease in expenditure on petroleum products and on household durables was the main contributing factor to the decrease of consumption in August.
[* Volumes are chained and all figures are adjusted for working days and seasonality.]
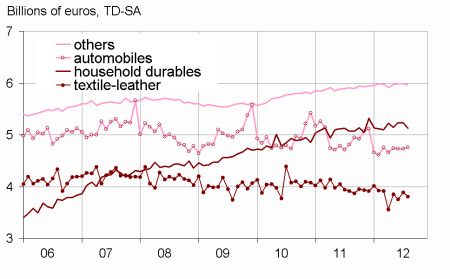
Engineered goods : slightly decreasing
Durables: decreasing
Households’ expenditure on durables decreased in July (-0.1%) and in August ( -0.5%). This decrease was mainly caused by a decline in expenditure on household durables (–0.1% in July, then -2.0% in August), especially furniture purchases. On the other hand, after a stabilization in July, car purchases improved in August (+0.6%), driven up by the secondhand market.
Textile-leather: bouncing in July, decreasing in August
Consumption of textile and leather bounced back in July (+3.7%, after -2.6% in June). It could be attributable to the late beginning of the official summer sales period. As a result expenditure then decreased in August (-2.2%).
Other engineered goods: decreasing in August
Consumption expenditure on other engineered goods were stable in July then decreased in August (-0.3%), notably in hardware consumption.
graphiquegraph1_new_ang – Total consumption of goods
graphiquegraph2_new_ang – Food and engineered goods
graphiquegraph3_new_ang – Decomposition of engineered goods
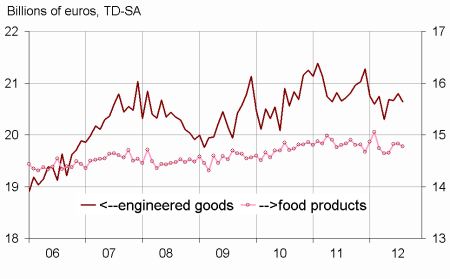
Food products: decreasing in August
Consumption of food products slightly increased in July (+0.1%, after +1.1% in June). It decreased in August (–0.4%), despite an increase of expenditure on tobacco.
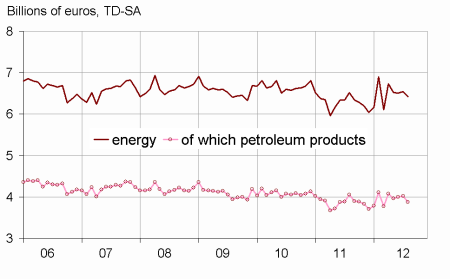
Energy: increasing in July, decreasing in August
Households’ consumption of energy products slightly increased in July (+0.5%) then decreased in August (–1.8%). The decrease in August mainly resulted from a drop in expenditure on fuel.
The evolution of household consumption on goods in June is scaled up by 0.3 point.
The change of household consumption on goods in June is now estimated at +0.4%, instead of +0.1% estimated for the previous publication in July 2012.
This revision is mainly due to the integration of new information concerning expenditure in energy products and to the revision of seasonality.
tableauenglish_trim – Households consumption expenditures on goods
| June | July | August | August 12/ | |
|---|---|---|---|---|
| 2012 | 2012 | 2012 | August 11 | |
| Food products | 14.819 | 14.832 | 14.772 | |
| Change (%) | 1.1 | 0.1 | –0.4 | –0.4 |
| Engineered goods | 20.667 | 20.800 | 20.639 | |
| change (%) | –0.1 | 0.6 | –0.8 | –0.4 |
| Of which: | ||||
| Automobiles | 4.730 | 4.728 | 4.759 | |
| Change (%) | –0.2 | 0.0 | 0.6 | –1.2 |
| Household durables | 5.232 | 5.229 | 5.123 | |
| Change (%) | 1.7 | –0.1 | –2.0 | 1.0 |
| Textile-leather | 3.751 | 3.888 | 3.805 | |
| Change (%) | –2.6 | 3.7 | –2.2 | –2.8 |
| Other engineered goods | 5.991 | 5.988 | 5.971 | |
| Change (%) | 0.3 | 0.0 | –0.3 | 1.1 |
| Energy | 6.507 | 6.540 | 6.419 | |
| Change (%) | –0.2 | 0.5 | –1.8 | –1.6 |
| Including petroleum products | 3.999 | 4.018 | 3.876 | |
| Change (%) | 0.8 | 0.5 | –3.5 | –4.5 |
| Total | 41.979 | 42.152 | 41.799 | |
| Change (%) | 0.4 | 0.4 | –0.8 | –0.5 |
| Manufactured goods | 36.360 | 36.513 | 36.153 | |
| Change (%) | 0.5 | 0.4 | –1.0 | –0.9 |
graphiquegraph4_new_ang – Energy
Documentation
Methodology (pdf,23 Ko)