

 4 June 2015
2015- n° 136The unemployment rate decreased by 0.1 point in Q1 2015 ILO Unemployment and Labour Market-related indicators (Labour Force Survey results)
- 1st Quarter 2015
4 June 2015
2015- n° 136The unemployment rate decreased by 0.1 point in Q1 2015 ILO Unemployment and Labour Market-related indicators (Labour Force Survey results)
- 1st Quarter 2015
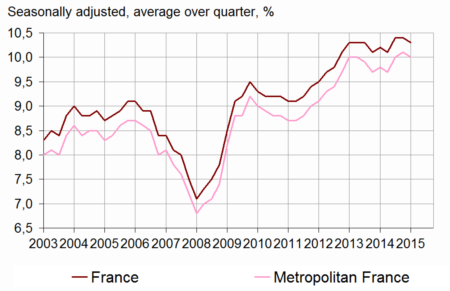
In Q1 2015, the average ILO unemployment rate in metropolitan France and overseas departments stood at 10.3% of active population, after 10.4% in Q4 2014. In metropolitan France only, with 2.9 million people, 10.0% of the active population was unemployed. The unemployment rate decreased by 0.1 percentage points q-o-q, especially for persons aged 50 and over. Over a year, it increased by 0.2 percentage points.
Decrease in unemployment rate in Q1 2015
In Q1 2015, the average ILO unemployment rate in metropolitan France and overseas departments stood at 10.3% of active population, after 10.4% in Q4 2014. In metropolitan France only, with 2.9 million people, 10.0% of the active population was unemployed. The unemployment rate decreased by 0.1 percentage points q-o-q, especially for persons aged 50 and over. Over a year, it increased by 0.2 percentage points.
graphiquegraph_cho_nvIR – ILO-unemployment rate
- Estimation close to +/-0.3 point of the level of unemployment rate and of its quarterly variations
- Covers the population of people living in households, people aged 15 years or more
- Source: INSEE, Labour Force Survey
Significant increase in unemployment halo
In metropolitan France, among inactive people, 1.5 million wish to work but they are not considered as unemployed: they are part of the halo around unemployment. The number of people in this unemployment halo rose by 71,000 in Q1 2015. This increase mainly concerns persons who wish to work, are available to take a job, but didn’t seek one. Over the year, the unemployment halo rose by 104,000 persons.
tableautab_cho_nvIR – Ilo-unemployment rate in metropolitan France
| ILO-unemployment rate (%) | Variation in point | Thousands | |||
|---|---|---|---|---|---|
| 2014Q4 | 2015Q1 (p)* | over quarter | over year | 2015Q1 (p)* | |
| Total | 10.1 | 10.0 | -0.1 | 0.2 | 2,858 |
| 15-24 years | 23.9 | 24.1 | 0.2 | 1.2 | 648 |
| 25-49 years | 9.5 | 9.5 | 0.0 | 0.4 | 1,690 |
| 50 years and more | 6.8 | 6.4 | -0.4 | -0.4 | 520 |
| Men | 10.5 | 10.4 | -0.1 | 0.3 | 1,544 |
| 15-24 years | 25.5 | 25.6 | 0.1 | 2.4 | 374 |
| 25-49 years | 9.5 | 9.6 | 0.1 | 0.1 | 892 |
| 50 years and more | 7.2 | 6.7 | -0.5 | 0.0 | 278 |
| Women | 9.7 | 9.6 | -0.1 | 0.2 | 1,314 |
| 15-24 years | 21.9 | 22.4 | 0.5 | -0.2 | 274 |
| 25-49 years | 9.5 | 9.3 | -0.2 | 0.6 | 798 |
| 50 years and more | 6.3 | 6.1 | -0.2 | -0.8 | 242 |
- *(p) = provisional results
- Covers the population of people living in households in metropolitan France, people aged 15 years or more
- Source: INSEE, Labour Force Survey
graphiquegraph_halo_IR – People in unemployment's halo

- Covers the population of people living in households in metropolitan France, people aged 15 years or more
- Source: INSEE, Labour Force Survey
The employment rate and the activity rate decreased
The employment rate of the population aged 15-64 years stood at 64.1% in Q1 2015. It decreased by 0.2 percentage points quarter-on-quarter.
tableautab_partpop_nvIR – ILO employment, unemployment and activity in the population aged 15-64 years
| % of people in the age group | Variation in point over | Thousands (1) | |||
|---|---|---|---|---|---|
| 2014Q4 | 2015Q1 (p)* | quarter | year | 2015Q1 (p)* | |
| Employed people | 64.3 | 64.1 | -0.2 | -0.2 | 25 463 |
| Full-time equivalent employment rate | 59.4 | 59.3 | -0.1 | -0.1 | 23 545 |
| Men | 67.7 | 67.5 | -0.2 | -0.2 | 13 168 |
| Women | 61.0 | 60.9 | -0.1 | -0.1 | 12 296 |
| 15-24 years | 28.3 | 28.3 | 0.0 | -0.3 | 2 038 |
| 25-49 years | 80.2 | 79.8 | -0.4 | -0.9 | 16 152 |
| 50-64 years | 59.2 | 59.4 | 0.2 | 1.2 | 7 273 |
| Included : 55-64 years | 47.9 | 48.3 | 0.4 | 2.1 | 3 852 |
| Core employment rate of 55-64 years | 47.5 | 48.0 | 0.5 | 2.0 | |
| Unemployed persons | 7.3 | 7.2 | -0.1 | 0.2 | 2 852 |
| Men | 8.0 | 7.9 | -0.1 | 0.2 | 1 538 |
| Women | 6.6 | 6.5 | -0.1 | 0.1 | 1 313 |
| 15-24 years | 8.9 | 9.0 | 0.1 | 0.5 | 648 |
| 25-49 years | 8.4 | 8.3 | -0.1 | 0.2 | 1 690 |
| 50-64 years | 4.4 | 4.2 | -0.2 | -0.1 | 513 |
| Included : 55-64 years | 3.8 | 3.5 | -0.3 | -0.2 | 278 |
| Active people | 71.6 | 71.3 | -0.3 | 0.0 | 28 315 |
| Men | 75.7 | 75.4 | -0.3 | 0.0 | 14 706 |
| Women | 67.6 | 67.4 | -0.2 | 0.0 | 13 609 |
| 15-24 years | 37.2 | 37.3 | 0.1 | 0.2 | 2 687 |
| 25-49 years | 88.6 | 88.1 | -0.5 | -0.7 | 17 842 |
| 50-64 years | 63.6 | 63.5 | -0.1 | 1.0 | 7 786 |
| Included : 55-64 years | 51.6 | 51.8 | 0.2 | 1.9 | 4 131 |
| Active life expectancy of 55-64 years (years) | 5.1 | 5.1 | 0.0 | 0.1 | |
- *(p) = provisional results
- Covers the population of people living in households in metropolitan France, people aged 15 years or more
- (1) those data cover the people who are 15-64 years old. They are a little bit different of the data in the previous table (which covers the total population).
- Source: INSEE, Labour Force Survey
Permanent contracts employment rate decreased by 0.3 percentage points in Q1 2015, at 48.8% of the population aged 15-64. Temporary contracts employment rate increased by 0.1 percentage points, at 7.0%.
The activity rate of people aged 15-64 stood at 71.3% in Q1 2015. It decreased by 0.3 percentage points quarter-on-quarter, and remained stable year-on-year.
Underemployment concerns 6.5% of employed people
In Q1 2015, 6.5% of the employed persons were underemployed, as in Q4 2014. Slack work stood at 0.2% of the employed, decreasing by 0.1 points quarter-on-quarter.
tableauTab_ssemp_nvIR – ILO underemployment
| ILO underemployment rate (%) | Variation in point | Thousands | |||
|---|---|---|---|---|---|
| 2014Q4 | 2015Q1 (p)* | Over a quarter | Over a year | 2015Q1 (p)* | |
| Total | 6.5 | 6.5 | 0.0 | 0.2 | 1 682 |
| Included : slack work | 0.3 | 0.2 | -0.1 | 0.0 | 63 |
| Men | 3.7 | 3.6 | -0.1 | 0.5 | 480 |
| Women | 9.5 | 9.6 | 0.1 | 0.0 | 1 202 |
- *(p) = provisional results
- Covers the population of people living in households in metropolitan France, people aged 15 years or more
- Source : INSEE, Labour Force Survey
Revision
The ILO unemployment rate of Q1, Q3 and Q4 2014 are revised upwards by 0.1 points, compared to the temporary publication of March 2015. For those quarters, besides the usual revisions, the weighting of the Labour Force Survey has been revised to include the results of the census 2012, as well as the results of the continuous Labour Force Survey in overseas departments.