

 29 August 2014
2014- n° 199Overall producer prices of agricultural products decreased in July Indices of agricultural prices - July 2014
29 August 2014
2014- n° 199Overall producer prices of agricultural products decreased in July Indices of agricultural prices - July 2014
In July, overall agricultural producer prices dropped by 1.1 % compared to June; over one year they fell by 5.4 %.
In July, overall agricultural producer prices dropped by 1.1 % compared to June; over one year they fell by 5.4 %.
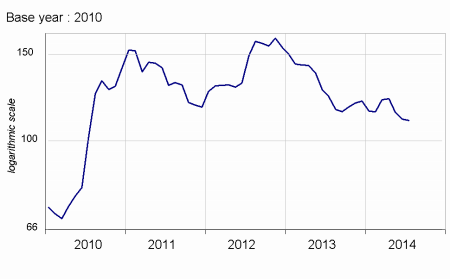
Cereal prices have been decreasing for three months, as they showed in July a drop of almost 10 % compared to last April, due to abundant availabilities. The huge crops of wheat and maïze, in Europe and in the United States, will indeed add up to the already high stocks.
graphiquecereal – Producer prices of cereals
Oleaginous prices went down in July (–7.1 %). Rape prices, the main grain grown in France, sharply decreased as a result of a rising global production of oleaginous.
Overall prices of wines increased by 12.2 % over one year (and by 18.2 % for PDO wines), further to the drop in crops for the last two years.
Potato prices tumbled compared to last year (-49.8 %). This was a return to normal as the last but one crop, in 2012, had been particularly weak in North-Western Europe.
Fresh fruit prices dropped year-over-year (–25.9 %). Apricots and peaches abounded as their productions recovered this year, whereas the rainy weather during July did not encourage their consumptions. In addition, the competition from Southern Europe limited the exportation outlets and the Spanish peaches flooded the French market.
graphiquevegetable – Producer prices of vegetables
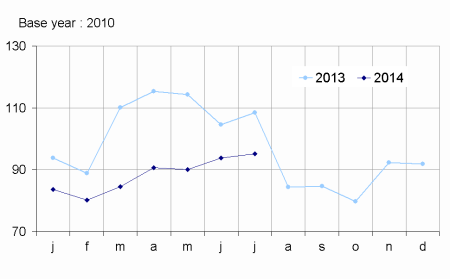
Fresh vegetables prices went down year-over-year (–12.3 %). The dull weather of July slowed down the consumption of summer vegetables. Tomato prices plumeted, while those of cucumber and melon fell more moderately due to climate hazard that affected their yields.
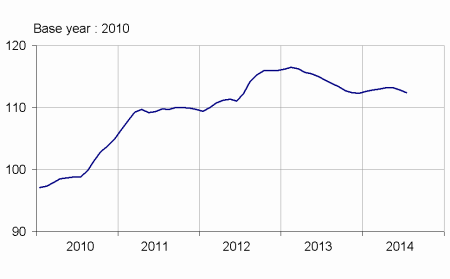
graphiquepig – Producer prices of pigs and large cattle

On a seasonally adjusted basis, animal prices decreased in July (-0.7 % over one month, –3.6 % over one quarter). The Russian embargo on European pig kept weighting on prices (-6.4% over one quarter). Households moderately consumed veal and beef, which resulted in significant drops in prices of these animals over one quarter (respectively -7.0 % and –3.3 %).
tableauTab1 – Indices of producer prices of agricultural products (IPPAP)
| Variation as % over | |||||
|---|---|---|---|---|---|
| weights | July 2014 | a month | 3 months | a year | |
| raw | Seasonally adjusted | raw | |||
| Agricultural goods output | 1000 | 116.1 | –1.1 | –4.0 | –5.4 |
| excluding fruits and vegetables | 900 | 118.7 | –0.9 | –3.9 | –4.4 |
| Crop output (excluding fruits and vegetables) | 503 | 116.6 | –1.3 | –5.5 | –6.3 |
| Cereals | 188 | 110.0 | –0.6 | –9.7 | –10.7 |
| of which soft wheat | 112 | 108.8 | –1.0 | –11.5 | –6.6 |
| grain maize | 41 | 97.1 | –4.0 | –11.8 | –27.0 |
| Potatoes | 26 | 112.0 | /// | /// | –49.8 |
| Wines | 177 | 132.4 | –1.3 | +0.2 | +12.2 |
| Protected designation of origin | 84 | 143.4 | –1.9 | –0.6 | +18.2 |
| other wines | 23 | 136.6 | –1.4 | +4.0 | +9.7 |
| Oleaginous | 49 | 88.0 | –7.1 | –16.2 | –17.6 |
| Horticultural products | 30 | 106.6 | +0.9 | +3.2 | +2.2 |
| Other crop products | 33 | 124.1 | –0.9 | –0.3 | –5.7 |
| Fruits and vegetables (1) | 100 | 93.1 | /// | /// | –15.9 |
| Fresh vegetables | 53 | 95.1 | /// | /// | –12.3 |
| Fresh fruits | 35 | 84.7 | /// | /// | –25.9 |
| Animal output | 397 | 121.4 | –0.2 | –1.7 | –2.0 |
| Animals | 235 | 119.4 | –0.7 | –3.6 | –6.1 |
| of which large cattle | 96 | 121.7 | –0.8 | –3.3 | –9.0 |
| calves | 26 | 105.9 | –3.1 | –7.0 | –0.9 |
| pigs | 54 | 126.6 | –0.6 | –6.4 | –4.5 |
| sheep | 10 | 117.0 | +0.3 | –0.9 | –0.6 |
| poultry | 46 | 115.6 | +0.2 | +0.4 | –5.8 |
| of which chicken | 28 | 115.9 | +0.4 | +0.5 | –5.8 |
| Milk | 147 | 124.8 | 0.0 | –0.1 | +2.8 |
| of which cow milk (2) | 137 | 126.4 | 0.0 | 0.0 | +2.9 |
| Eggs | 15 | 119.2 | +5.0 | +14.2 | +24.5 |
- (1) Including vegetables for industry.
- (2) The price for July is not yet known and therefore is estimated by carrying forward the seasonally adjusted price from June
- Sources: Insee - SSP (ministry of agriculture)
Purchase prices of the means of agricultural production in July.
Intermediate consumptions prices slipped by 0.5% in July. Over one year fertilisers and animal feed prices decreased roughly by respectively 4 % and 7 %. Investment prices were stable in July.
graphiquemeans – Purchase price of the means of agricultural production
- Sources : Insee - SSP (ministry of agriculture)
tableauTab2 – Indices of purchase prices of the means of agricultural production (IPAMPA)
| weights | July 2014 | Variation as % over | |||
|---|---|---|---|---|---|
| a month | 3 months | a year | |||
| Total input | 1000 | 112.4 | –0.4 | –0.7 | –1.7 |
| Intermediate consumptions | 764 | 114.3 | –0.5 | –0.9 | –2.5 |
| Energy | 100 | 117.7 | –0.1 | +0.5 | –1.1 |
| Seeds | 57 | 108.7 | +0.2 | –0.2 | +0.8 |
| Fertilisers and soil improvers | 92 | 115.1 | –1.5 | –3.7 | –4.1 |
| Plant protection products | 78 | 101.1 | –0.2 | 0.0 | +0.1 |
| Animal feed | 205 | 124.0 | –1.3 | –1.8 | –7.2 |
| Veterinary expenses | 43 | 111.5 | 0.0 | +0.5 | +2.1 |
| Small equipment and tools | 17 | 109.0 | +0.2 | +1.0 | –0.4 |
| Maintenance of materials | 67 | 111.6 | +0.3 | +0.3 | +2.6 |
| Maintenance of buildings | 9 | 106.7 | +0.1 | –0.1 | 0.0 |
| Other goods and services | 97 | 101.9 | +0.1 | 0.0 | +0.4 |
| Goods and services contributing to investment | 236 | 106.7 | 0.0 | 0.0 | +0.8 |
| Material | 186 | 106.8 | +0.2 | +0.1 | +1.3 |
| Tractors | 79 | 106.4 | 0.0 | –0.5 | +0.9 |
| Machinery and plant for cultivation | 36 | 108.2 | 0.0 | +0.6 | +2.8 |
| Machinery and plant for harvesting | 42 | 107.0 | 0.0 | +0.1 | +0.6 |
| Utility vehicles | 18 | 105.9 | +1.4 | +1.1 | +2.6 |
| Buildings | 50 | 106.3 | –0.6 | –0.5 | –1.0 |
- (1) The repayment of the domestic tax on energy products (TICPE) benefiting farmers has been applied in advance for the year 2014
- Sources: Insee - SSP (ministry of agriculture)
Documentation
Methodology (pdf,122 Ko)
Pour en savoir plus
Time series : Indices of agricultural prices