

 4 January 2012
2012- n° 2In November, households’ consumption in goods decreased very slightly (–0.1%) Household consumption expenditure on goods - November 2011
4 January 2012
2012- n° 2In November, households’ consumption in goods decreased very slightly (–0.1%) Household consumption expenditure on goods - November 2011
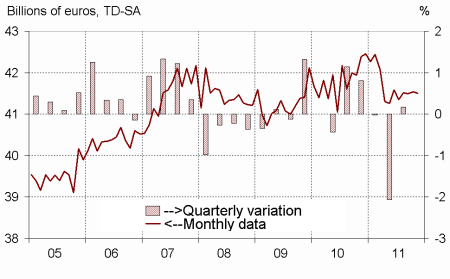
In November, households’ expenditure in goods decreased by 0.1% in volume*, after having increased by 0.1% in October. On the one hand, consumption of car purchases bounced. But on the other hand, consumption of textile-leather and expenditure in energy products decreased.
In November, households’ expenditure in goods decreased by 0.1% in volume*, after having increased by 0.1% in October. On the one hand, consumption of car purchases bounced. But on the other hand, consumption of textile-leather and expenditure in energy products decreased.
[* Volumes are chained and all figures are trading days and seasonally adjusted.]
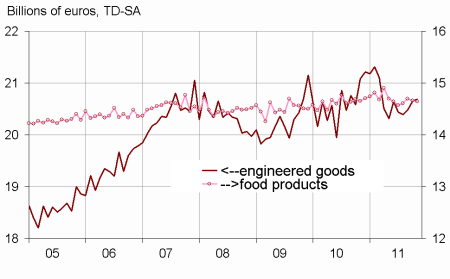
Engineered goods : slightly increasing
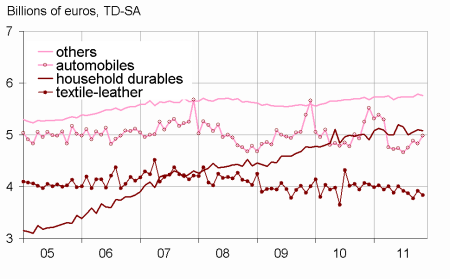
Durables : increasing
Households’ expenditure in durables increased in November (+1.5%), after the decrease in October (-0.3%). This is due to car purchases which bounced (+3.2% after -1.1% in October), on the new and second hand markets. Expenditure in household durables nevertheless declined (-0.5% after +0.9%).
Textile-leather : decreasing
Purchases in textile and leather decreased in November (-2.1%) after an increase the previous month (+3.7%).
Other engineered goods : slightly decreasing
Consumption expenditure in other engineered goods slightly decreased in November (-0.5%, after +1.0% in October). Those in hardware are notably in sharp decline.
graphiquegraph1_new_ang – Total consumption of goods
graphiquegraph2_new_ang – Food and engineered goods
graphiquegraph3_new_ang – Decomposition of engineered goods
Food products : slightly decreasing
Consumption in food products slightly decreased in November (–0.1% after -0.2% in October). Expenditures in tobacco notably continued to decline, related to an increase of tobacco prices mid-October.
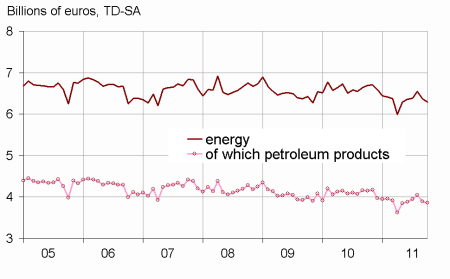
Energy : decreasing too
With mild temperatures in comparison to normal seasonal levels, consumption of energy products decreased again in November (–0.8% after –1.1% in October), mainly because of a drop in expenditures in fuel and electricity. .
The evolution of household consumption in goods in October is revised to +0.1% instead of 0.0%.
The increase of household consumption in goods is now estimated at +0.1% in October, instead of a stability estimated the previous month.
This revision is notably due to the integration of new information concerning expenditure in health products, as well as the revision of seasonality.
tableautab1_eng – Households consumption expenditures in goods
| Sept. | Oct. | Nov. | Nov.11/ | |
|---|---|---|---|---|
| 2011 | 2011 | 2011 | Nov.10 | |
| Food products | 14.697 | 14.661 | 14.644 | |
| Change (%) | 0.6 | –0.2 | –0.1 | 0.0 |
| Engineered goods | 20.477 | 20.649 | 20.689 | |
| change (%) | 0.4 | 0.8 | 0.2 | –1.9 |
| Of which: | ||||
| Automobiles | 4.880 | 4.828 | 4.980 | |
| Change (%) | 2.7 | –1.1 | 3.2 | –5.1 |
| Household durables | 5.057 | 5.100 | 5.077 | |
| Change (%) | 1.1 | 0.9 | –0.5 | 1.4 |
| Textile-leather | 3.778 | 3.918 | 3.837 | |
| Change (%) | –2.6 | 3.7 | –2.1 | 0.0 |
| Other engineered goods | 5.731 | 5.786 | 5.757 | |
| Change (%) | 0.0 | 1.0 | –0.5 | 0.6 |
| Energy | 6.368 | 6.297 | 6.249 | |
| Change (%) | –2.7 | –1.1 | –0.8 | –6.9 |
| Including petroleum products | 3.892 | 3.860 | 3.838 | |
| Change (%) | –3.9 | –0.8 | –0.6 | –8.0 |
| Total | 41.493 | 41.537 | 41.502 | |
| Change (%) | –0.1 | 0.1 | –0.1 | –2.1 |
| Manufactured goods | 36.034 | 36.128 | 36.112 | |
| Change (%) | 0.1 | 0.3 | 0.0 | –1.8 |
graphiquegraph4_new_ang – Energy
Documentation
Methodology (pdf,23 Ko)