

 12 June 2013
2013- n° 135In May 2013, prices of frequently purchased goods in Hyper and Supermarkets decreased
by 0.1% Price Index in large and predominantly-food stores - May 2013
12 June 2013
2013- n° 135In May 2013, prices of frequently purchased goods in Hyper and Supermarkets decreased
by 0.1% Price Index in large and predominantly-food stores - May 2013
In Hyper and Supermarkets, prices of frequently purchased goods decreased by 0.1% in May; they were stable in April.
- Year-on-year, prices grew by 0.4% in hyper and supermarkets
- Decline in hypermarket prices (—0.2%), increase (+0.1%) in the supermarkets
- In the other retail stores, prices of frequently purchased goods were up 0.3% in April
- Excluding fresh foodstuffs, food and beverage prices were stable in May in the hyper and supermarkets
- Decrease in prices of the cleaning and personal care products in May 2013
In Hyper and Supermarkets, prices of frequently purchased goods decreased by 0.1% in May; they were stable in April.
Year-on-year, prices grew by 0.4% in hyper and supermarkets
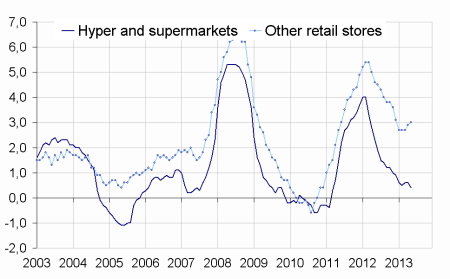
In May 2013, prices of frequently purchased goods were 0.4% higher than those of the year before in hyper and supermarkets (after +0/6% in April and March 2013). They were up 2.3% year on year in May 2012.
Decline in hypermarket prices (—0.2%), increase (+0.1%) in the supermarkets
In May 2013, the prices of frequently purchased good in hypermarkets went down by 0.2%. They have already declined by 0.1% in April 2013.
Over a year, frequently purchased good prices rose by 0.3% in hypermarkets (after +0.6% in April). In May 2012, they increased by 1.9%, year on year.
In supermarkets, frequently purchased good prices went up by 0.1% in May 2013, like in April 2013.
Over a year, frequently purchased good prices rose by 0.6% in supermarkets in May 2013 (after +0.7% in April and +0.8% in March 2013). In May 2012, they increased by 2.8%, year on year.
graphiqueGraphique1 – Frequently purchased goods price indexes annual changes (%)
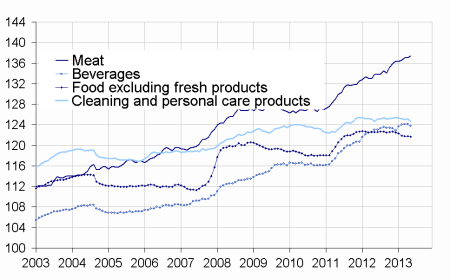
graphiqueGraphique2 – Frequently purchased goods price indexes
- Source : INSEE – Consumer Price Indeces, base 100 : 1998
tableauTableau1 – Prices of frequently purchased goods
| Variations (%) over | |||
|---|---|---|---|
| Index May 2013 | one month | 12 last months | |
| Hyper-and-Supermarkets (A) | 126,1 | –0,1 | 0,4 |
| - Hypermarkets | 125,3 | –0,2 | 0,3 |
| - Supermarkets | 127,8 | 0,1 | 0,6 |
| Large and predominantly food stores (A + neighborhood stores) | 127,7 | 0,0 | 0,6 |
| Other (mini-markets, maxi discount, department stores…) | 137,1 | 0,3 | 3,0 |
| Total | 129,7 | 0,1 | 0,9 |
- Source : INSEE – Consumer Price Indeces
tableau – Prices of frequently purchased goods detailed by main items
| Variations (%) over | |||
|---|---|---|---|
| Index May 2013 | one month | 12 last months | |
| Food and beverages (excluding fresh foodstuffs) | 126,5 | 0,0 | 0,5 |
| - Meat | 137,4 | 0,3 | 2,7 |
| - Beverages | 123,8 | –0,2 | 0,7 |
| - Other food products | 121,7 | –0,1 | –0,7 |
| Clearing and personal care products | 124,7 | –0,3 | 0,0 |
| Total : Hyper-and-Supermarkets | 126,1 | –0,1 | 0,4 |
- Source : INSEE – Consumer Price Indeces
In the other retail stores, prices of frequently purchased goods were up 0.3% in April
In the other retail stores, prices of frequently purchased goods went up by 0.3% in May, like in April and March 2013. Over a year, they rose by 3.0% in May after +2.9% in April.
In May 2012, prices of frequently purchased goods rose by 4.6% in the other retail stores year on year.
Excluding fresh foodstuffs, food and beverage prices were stable in May in the hyper and supermarkets
Excluding fresh products, food and beverage prices were steady in the hyper and supermarkets in May 2013, like in April 2013. Year on year, they rose by 0.5% in May 2013 (after +0.7% in April 2013 and +0.8% in March 2013). In May 2012, they grew by 2.5%, year on year.
In May 2013, the meat prices were up 0.3% in the hyper and supermarkets (they were stable in April 2013). Year on year, they increased by 2.7% in May (after +3.0% in April). In May 2012, the meat prices went up by 3.0% in the hyper and supermarkets.
In the hyper and supermarkets, the beverage prices grew by 0.2% in May after they were stable in April 2013. Beverage prices rose by 0.7% year on year in May 2013 (after +1.2% in April 2013). The excise duty increases on alcohol from January 2013 were offset by the decline in the prices of the non-alcoholic beverages. In May 2012, the beverage prices grew by 3.9% in the hyper and supermarkets.
In May 2013, prices of the other food products (excluding fresh foodstuffs) decreased by 0.1% after they stayed steady in April. They dipped by 0.7% in May year on year, like in April. In May 2012, they rose by 1.7% year on year.
Decrease in prices of the cleaning and personal care products in May 2013
In May 2013, prices of the cleaning and personal care products declined by 0.3% after an slight increase in April (+0.1%). Over a year, they were stable in May (like in April); they grew by 1.3% in the year to May 2012.