

 30 November 2012
2012- n° 294Households consumption of goods slightly decreased in October (–0.2%) Household consumption expenditure on goods - October 2012
30 November 2012
2012- n° 294Households consumption of goods slightly decreased in October (–0.2%) Household consumption expenditure on goods - October 2012
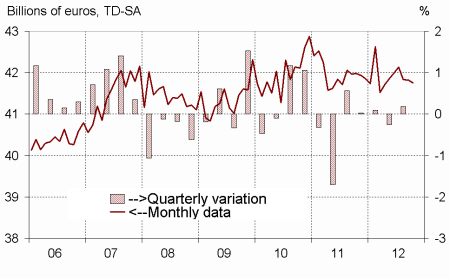
In October, households expenditure on goods decreased by 0.2% in volume*, after a stability in September. In particular, the increase in purchases in durables did not offset the drop in expenditure on tobacco products.
In October, households expenditure on goods decreased by 0.2% in volume*, after a stability in September. In particular, the increase in purchases in durables did not offset the drop in expenditure on tobacco products.
[* Volumes are chained and all figures are trading days and seasonally adjusted.]
Engineered goods : increasing
Durables: increasing
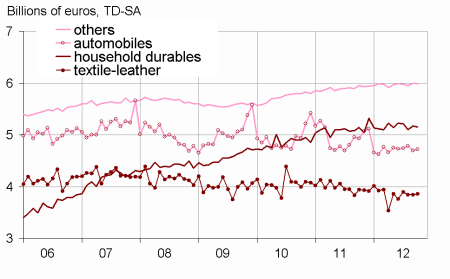
After a decrease in September (–0.4%), households expenditure on durable goods bounced in October (+0.5%). In particular, the increase in expenditure on cars (+0.7%, after –1.9%) was not offset by the decline of purchases in household durables (–0.4%, after +1.5%).
Textile-leather: also increasing
Households consumption of textile and leather increased in October (+0.5%, after a stability in September).
Other engineered goods: slightly decreasing
Consumption expenditure on other engineered goods slightly decreased in October (–0.1%, after +0.7% in September). Expenditure on hardware especially declined, after a sharp rise in September.
graphiquegraph1_new_ang – Total consumption of goods
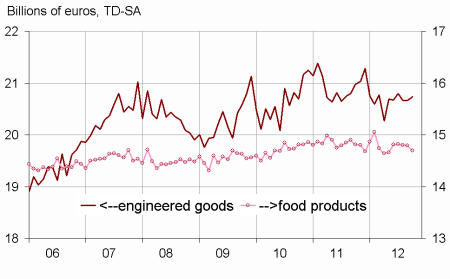
graphiquegraph2_new_ang – Food and engineered goods
graphiquegraph3_new_ang – Decomposition of engineered goods
Food products: decreasing
After two consecutive months of decline (-0.1% in August and September), consumption of food products decreased again in October (–0.6%). This decline resulted mainly from a drop in spending on tobacco products, due to an increase in prices from October 1st , 2012.
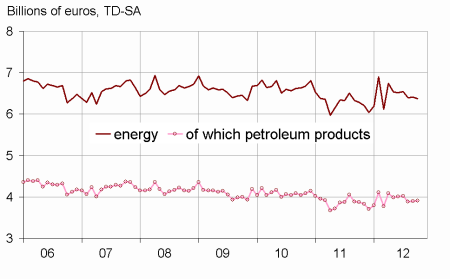
Energy: decreasing too
After a slight increase in September (+0.1%), households consumption of energy products declined in October (–0.5%). In particular, expenditure on gas and electricity weakened while those of carburant and fuel slightly improved.
The evolution of household consumption of goods in September is scaled down by 0.1 point
The change of household consumption of goods in September is now estimated at –0.1%, instead of a stability estimated for the previous publication.
This revision is mainly due to the integration of new information, notably a drop in automotive sector consumption in September, as well as the updating of the seasonal adjustment coefficients.
tableautab1_eng – Households consumption expenditure on goods
| August | Sept. | Oct. | Oct.12/ | |
|---|---|---|---|---|
| 2012 | 2012 | 2012 | Oct.11 | |
| Food products | 14.804 | 14.789 | 14.698 | |
| Change (%) | –0.1 | –0.1 | –0.6 | –0.8 |
| Engineered goods | 20.668 | 20.668 | 20.735 | |
| Change (%) | –0.6 | 0.0 | 0.3 | –1.1 |
| Of which: | ||||
| Automobiles | 4.787 | 4.694 | 4.725 | |
| Change (%) | 1.1 | –1.9 | 0.7 | –4.2 |
| Household durables | 5.099 | 5.175 | 5.152 | |
| Change (%) | –2.3 | 1.5 | –0.4 | 0.2 |
| Textile-leather | 3.844 | 3.845 | 3.864 | |
| Change (%) | –1.4 | 0.0 | 0.5 | –2.1 |
| Other engineered goods | 5.952 | 5.994 | 5.988 | |
| Change (%) | –0.4 | 0.7 | –0.1 | 0.6 |
| Energy | 6.398 | 6.405 | 6.370 | |
| Change (%) | –2.1 | 0.1 | –0.5 | 1.4 |
| Including petroleum products | 3.885 | 3.895 | 3.903 | |
| Change (%) | –3.3 | 0.3 | 0.2 | 0.7 |
| Total | 41.834 | 41.827 | 41.752 | |
| Change (%) | –0.7 | 0.0 | –0.2 | –0.5 |
| Manufactured goods | 36.201 | 36.190 | 36.196 | |
| Change (%) | –0.8 | 0.0 | 0.0 | –0.9 |
graphiquegraph4_new_ang – Energy
Documentation
Methodology (pdf,23 Ko)