

 11 June 2012
2012- n° 143In April 2012, manufacturing output decreased (-0.7%) Industrial production index - April 2012
11 June 2012
2012- n° 143In April 2012, manufacturing output decreased (-0.7%) Industrial production index - April 2012
In April 2012, manufacturing output decreased in volume (-0.7%). It had strongly increased in March (+1.4%). Output increased in total industry (+1.5%), supported by electricity and gas consumption linked to relatively low temperatures in April.
In April 2012, manufacturing output decreased in volume (-0.7%). It had strongly increased in March (+1.4%).
Output increased in total industry (+1.5%), supported by electricity and gas consumption linked to relatively low temperatures in April.
During the last quarter, manufacturing output decreased (-0.7%)…
During the last quarter (quarter-on-quarter change), output decreased in the manufacturing sector (-0.7%) and increased in the industry as a whole (+0.4%).
Output decreased in the manufacture of electrical and electronic equipment (-1.5%), in the “other manufacturing” (-0.5%) and in the manufacture of transport equipment (-0.2%).
Again, the manufacture of coke and refined petroleum products (-11.7%) has suffered of closing for maintenance.
…and was lower than its last year’s level by 1.8%
Manufacturing output decreased by 1.8% (y-o-y).
It decreased in the “other manufacturing“ (-2.4%), in the manufacture of electrical and electronic equipment and machine equipment (-2.1%). The manufacture of transport equipment is almost unchanged (-0.3%). Output strongly decreased in the manufacture of coke and refined petroleum products (-16.2%).
Please note: all the series are adjusted for seasonal variations (SA) and the number of working days (WDA).
graphiqueGraphique1a – Monthly industrial Production indexes
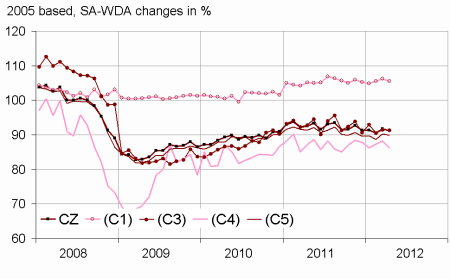
- Legend : CZ : Manufacturing - (C1) : Manufacture of food products and beverages - (C3) : Electrical and electronic equipment; machine equipment - (C4) : Manufacture of transport equipment - (C5) : Other manufacturing
- Sources : Insee, SSP, SOeS
tableauTableau 1 – Variation of the Industrial Production
| April / March | March / Feb. | Quarter on quarter change | Year on year change (1) | |
|---|---|---|---|---|
| BE: INDUSTRY | 1.5 | –1.0 | 0.4 | –0.6 |
| CZ: MANUFACTURING | –0.7 | 1.4 | –0.7 | –1.8 |
| (C1): Manufacture of food products and beverages | –0.6 | 0.7 | 0.4 | 1.1 |
| (C2): Manufacture of coke and refined petroleum products | 0.3 | 3.6 | –11.7 | –16.2 |
| (C3): Electrical and electronic equipment; machine equipment | –0.2 | 1.1 | –1.5 | –2.1 |
| (C4): Manufacture of transport equipment | –2.2 | 1.0 | –0.2 | –0.3 |
| (C5): Other manufacturing | –0.6 | 1.9 | –0.5 | –2.4 |
| (DE): Mining and quarrying; energy; water supply; waste management | 16.6 | –15.0 | 7.4 | 7.6 |
| FZ: Construction | 2.3 | 17.1 | –5.0 | –3.9 |
- (1) Last three months / three same months of previous year
- The codes correspond to the level of aggregation A 10 (A 17) of the "NA" aggregate classification based on NAF rev.2.
- Sources : INSEE, SSP, SOeS
tableauTableau 2 – Variation of the Industrial Production
| NA : A10, (A17), [A38 ou A64] | April 2012 | April / March | March / Feb. | Quarter on quarter change |
|---|---|---|---|---|
| BE: INDUSTRY | 93.0 | 1.5 | –1.0 | 0.4 |
| CZ: MANUFACTURING | 91.2 | –0.7 | 1.4 | –0.7 |
| (C1): Man. of food products and beverages | 105.6 | –0.6 | 0.7 | 0.4 |
| (C2): Man. of coke and refined petroleum products | 66.7 | 0.3 | 3.6 | –11.7 |
| (C3): Electrical and electronic equipment; machine equipment | 91.3 | –0.2 | 1.1 | –1.5 |
| [CI] Man. of computer, electronic and optical products | 96.2 | –0.6 | 1.5 | 0.7 |
| [CJ] Man. of electrical equipment | 99.3 | 0.2 | 2.3 | –4.5 |
| [CK] Man. of machinery and equipment n.e.c. (1) | 83.0 | –0.4 | 0.2 | –1.5 |
| (C4): Man. of transport equipment | 86.3 | –2.2 | 1.0 | –0.2 |
| [CL1] Man. of motor vehicles, trailers and semi-trailers | 67.4 | 0.3 | –2.5 | –1.5 |
| [CL2] Man. of other transport equipment | 124.9 | –4.7 | 5.0 | 1.3 |
| (C5): Other manufacturing | 89.8 | –0.6 | 1.9 | –0.5 |
| [CB] Man. of textiles, wearing apparel, leather and related products | 58.4 | 0.7 | 0.7 | –0.2 |
| [CC] Man. of wood and paper products; printing and reproduction of recorded media | 75.7 | –1.4 | 2.1 | –0.4 |
| [CE] Man. of chemicals and chemical products | 115.0 | 1.1 | 1.3 | 1.9 |
| [CF] Man. of basic pharmaceutical products and pharmaceutical preparations | 110.3 | –0.5 | –0.4 | –0.6 |
| [CG] Man. of rubber and plastics products, and other non-metallic mineral products | 84.4 | –1.7 | 5.9 | –3.6 |
| [CH] Man. of basic metals and fabricated metal products, except machinery and equipment | 79.8 | –1.1 | 1.5 | –1.1 |
| [CM] Other manufacturing; repair and installation of machinery and equipment | 107.2 | 0.6 | 0.6 | 2.2 |
| (DE): Mining and quarrying; energy; water supply; waste management | 105.3 | 16.6 | –15.0 | 7.4 |
| [BZ] Mining and quarrying | 86.2 | 0.3 | 24.0 | –9.9 |
| [DZ] Electricity, gas, steam and air-conditioning supply | 106.8 | 20.7 | –19.0 | 9.5 |
| [EZ] Water supply; sewerage, waste management and remediation | 106.6 | –2.6 | 1.6 | 2.2 |
| FZ: Construction | 98.7 | 2.3 | 17.1 | –5.0 |
| MIGs (2) | ||||
| Capital goods | 91.4 | –0.9 | 0.8 | 0.4 |
| Intermediate goods | 85.9 | –0.7 | 3.6 | –1.9 |
| Consumer durables | 83.1 | 0.5 | –0.4 | –1.5 |
| Consumer non-durables | 102.2 | –0.7 | 0.4 | 0.0 |
- (1) n.e.c. : not elsewhere classifiable
- (2) Main industrial groupings : definition in Commission regulation EC of 14 June 2007
- Sources : Insee, SSP, SOeS
Output strongly decreased in the manufacture of transport equipment (-2.2%)
Output strongly decreased in the manufacture of other transport equipment (-4.7%). However, it moderately increased in the manufacture of motor vehicles, trailers and semi-trailers (+0.3%).
Output also decreased in the « other manufacturing » (-0.6%)…
Output decreased in the manufacture of rubber and plastics products (-1.7%), in the manufacture of basic metals and fabricated metal products (-1.1%), in the manufacture of wood and paper products; printing and reproduction of record media (-1.4%) and less importantly in the manufacture of basic pharmaceutical products and pharmaceutical preparations (-0.5%). Meanwhile, it increased in the manufacture of chemicals and chemical products (+1.1%), in the other manufacturing, repair and installation of machinery and equipment (+0.6%) and in the manufacture of textiles. wearing apparel, leather and related products (+0.7%).
…and was almost stable in the manufacture of electrical and electronic equipment, machine equipment (-0.2%)
Output decreased in the manufacture of computer, electronic and optical products (-0.6%) and in the manufacture of machinery and equipment n.e.c. ( 0.4%). On the other hand, output slightly increased in the manufacture of electrical equipment (+0.2%).
By contrast, output strongly soared in mining and quarrying, energy, water supply, waste management
Output soared in the electricity, gas, steam and air-conditioning supply by 20.7%, due to climate’s harshness in April, following a very mild weather in March.
Revisions: null in March
tableauTableau 3 – Measure of variations’ revisions
| March / Feb. | Feb. / Jan. | Jan. / Dec. | Q1 2012 / Q4 2011 | 2011 / 2010 | |
|---|---|---|---|---|---|
| Industry (BE) | –0.11 | 0.00 | 0.00 | –0.14 | –0.06 |
| raw serie | –0.10 | 0.11 | 0.00 | –0.03 | –0.04 |
| SA-WDA coefficient | –0.01 | –0.11 | 0.00 | –0.11 | –0.02 |
| Manufacturing (CZ) | 0.00 | 0.00 | –0.11 | –0.22 | –0.04 |
| raw serie | 0.13 | 0.00 | 0.00 | –0.04 | –0.04 |
| SA-WDA coefficient | –0.13 | 0.00 | –0.11 | –0.18 | 0.00 |
- Note : in the manufacturing, the SA-WDA evolution between February and March is revised by 0.00 point : 0.13 is due to the raw serie's revision and -0.13 to the new calculation of the SA-WDA.
- Sources : Insee, SSP, SOeS
- Learn more:
Documentation
Methodology (pdf,163 Ko)