

 24 July 2012
2012- n° 184In July 2012, the economic climate in services remains sluggish Monthly survey of services - July 2012
24 July 2012
2012- n° 184In July 2012, the economic climate in services remains sluggish Monthly survey of services - July 2012
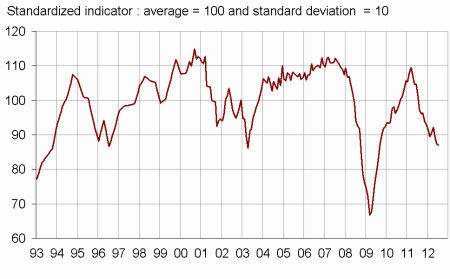
According to the business leaders surveyed in July 2012, the economic situation in services remains sluggish. The business climate synthetic indicator stabilizes in July, and is 87, still below its long-term average (100). The turning point indicator indicates an unfavourable economic situation.
According to the business leaders surveyed in July 2012, the economic situation in services remains sluggish. The business climate synthetic indicator stabilizes in July, and is 87, still below its long-term average (100). The turning point indicator indicates an unfavourable economic situation.
Business leaders consider that their activity slow down the last few months. The balances of opinion relative to expected activity and expected demand remain damaged.
They consider that their operating balance result decreased in the last few months and remain pessimistic in their expectations for the coming months.
The general outlook drops by three points compared with June.
Job creations remain scarce
In services except temporary employment agencies, business leaders are likely to indicate a decline in employement over the recent period. According to them, job creations should remain scarce in the coming months.
graphiqueGraph1 – Business climate synthetic indicator
graphiquegraph_retourn – Turning point indicator
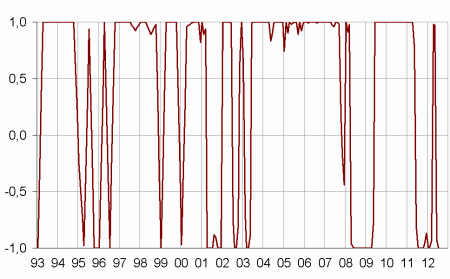
- Note: close to 1 (respectively -1), this indicator indicates a favourable short-term economic situation (respectively unfavourable).
tableauTable_quarter – Economic outlook in the services sector
| Average* | Apr. 12 | May 12 | June 12 | July 12 | |
|---|---|---|---|---|---|
| Business climate synthetic indicator | 100 | 92 | 89 | 87 | 87 |
| General outlook | –6 | –13 | –18 | –18 | –21 |
| Past activity | 4 | –1 | –4 | –4 | –13 |
| Expected activity | 3 | –5 | –8 | –12 | –9 |
| Expected demand | 1 | –6 | –9 | –11 | –9 |
| Business situation | 0 | –8 | –13 | –15 | –16 |
| Past selling prices | –2 | –4 | –4 | –5 | –7 |
| Expected selling prices | –1 | –4 | –6 | –6 | –5 |
| Past employment | 3 | –3 | –2 | –14 | –15 |
| except temporary work agencies | 1 | –4 | 0 | –6 | –6 |
| Expected employment | 3 | –2 | –12 | –10 | –2 |
| except temporary work agencies | 0 | –4 | –7 | –7 | –6 |
| Investments | |||||
| Past investments | 2 | 3 | 0 | 3 | –6 |
| Expected investments | 2 | –1 | –3 | –5 | –7 |
| Operating balance result | |||||
| Past result | –1 | –7 | –16 | ||
| Expected result | –1 | –12 | –15 | ||
| Cash position | –10 | –11 | –15 | ||
| Difficulties of supply and demand | |||||
| difficulties of supply and demand | 9 | 13 | 11 | ||
| difficulties of supply only | 23 | 20 | 20 | ||
| difficulties of demand only | 29 | 32 | 40 | ||
| Difficulties in recruitment | 30 | 22 | 19 |
- * Average of the balances of opinion since 1988
- Source: Insee
Documentation
Methodology (2016) (pdf,158 Ko)
Pour en savoir plus
Time series : Economic outlook surveys – Services