

 29 August 2013
2013- n° 196In august 2013, the business climate improved slightly in services sector Monthly survey of services - August 2013
29 August 2013
2013- n° 196In august 2013, the business climate improved slightly in services sector Monthly survey of services - August 2013
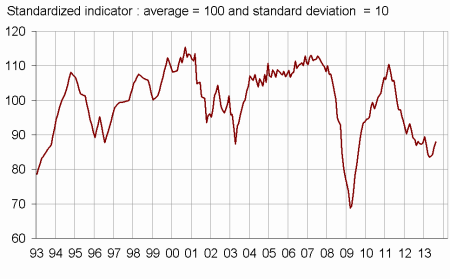
According to business managers, the economic situation in services improved slightly in august 2013. The business climate synthetic indicator rose by two points, and reaches 88, still below its long-term average (100).
All services sector
According to business managers, the economic situation in services improved slightly in august 2013. The business climate synthetic indicator rose by two points, and reaches 88, still below its long-term average (100).
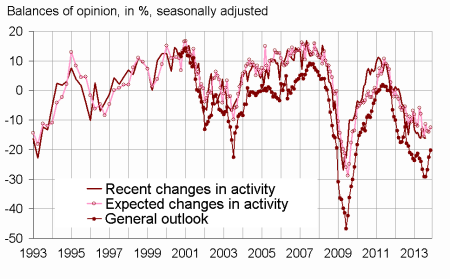
Business managers consider that their activity remained damaged in the last few months. Their expectations of business and demand have been recovering slightly.
The general outlook rose by two points compared with July but remained well below its long-term average. The turning point indicator indicates a favourable economic dynamic.
Employment is still sluggish
In services sector (except temporary employment agencies), business managers consider that employment remained sluggish. However, more of them have been anticipating a rebound in employment for the coming months.
tableauTable_quarter – Economic outlook in the services sector
| Average* | May 13 | June 13 | July 13 | Aug. 13 | |
|---|---|---|---|---|---|
| Composite indicator | 100 | 84 | 84 | 86 | 88 |
| General outlook | –7 | –29 | –27 | –22 | –20 |
| Past activity | 3 | –16 | –12 | –16 | –16 |
| Expected activity | 3 | –11 | –14 | –14 | –12 |
| Expected demand | 0 | –17 | –16 | –13 | –9 |
| Business situation | –2 | –18 | –16 | –13 | –15 |
| Past selling prices | –3 | –12 | –12 | –12 | –11 |
| Expected selling prices | –2 | –12 | –12 | –13 | –11 |
| Past employment | 3 | –6 | –5 | –6 | –6 |
| except temporary work agencies | 1 | –5 | –8 | –5 | –10 |
| Expected employment | 2 | –13 | –8 | –7 | –4 |
| except temporary work agencies | 0 | –14 | –10 | –10 | –6 |
| Investments | |||||
| Past investments | 1 | –4 | –4 | –5 | –3 |
| Expected investments | 1 | –5 | –5 | 1 | –1 |
- * Average of the balances of opinion since 1988
- Source: Insee
graphiqueGraph1 – Composite indicator
graphiqueGraph2 – Activity
Road transport
In road freight and mail activities, less business managers than in July consider that activity declined in the recent months. Their expectations of activity and demand have been recovering.
Accommodation and food service activities
In accommodation and food service activities, business managers assess that activity remained gloomy in the recent period. Their forecasts of business and demand are pessimistic.
Information and communication
In information and communication, business managers indicate that activity declined over the last few months. Their expectations for the coming months remain unfavorable.
Real estate activities
In real estate activities, the balance of opinion on past activity went up. However, business managers do not expect an improvement in the coming months.
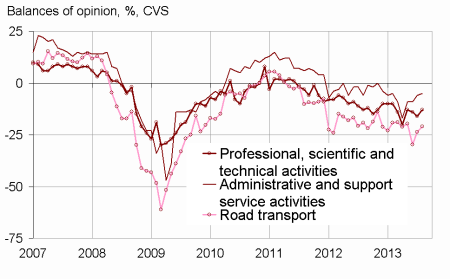
Professional, scientific and technical activities
In professional, scientific and technical activities, business managers estimate that activity remained degraded in the recent period. Their expectations of activity and demand have been recovering slightly.
Administrative and support service activities
In administrative and support service activities, business managers indicate that activity remained dull in the recent period. Their forecasts of activity are unchanged even if they expect to benefit from a better demand in the coming months.
graphiquegraph_bonus_ – Expected activity
tableauTable_det – Detailed data
| A21 | Average* | May 13 | June 13 | July 13 | Aug. 13 |
|---|---|---|---|---|---|
| (H) Road transport | |||||
| Past activity | –8 | –36 | –26 | –31 | –21 |
| Expected activity | –10 | –20 | –30 | –24 | –21 |
| Expected demand | –13 | –30 | –31 | –29 | –21 |
| Past employment | –8 | –19 | –17 | –9 | –7 |
| Expected employment | –11 | –21 | –18 | –17 | –13 |
| (I) Accommodation and food service activities | |||||
| Past activity | –6 | –39 | –28 | –19 | –20 |
| Expected activity | –7 | –25 | –21 | –27 | –26 |
| Expected demand | –9 | –27 | –27 | –31 | –27 |
| Past employment | –4 | –11 | –14 | –11 | –18 |
| Expected employment | –5 | –20 | –14 | –13 | –13 |
| (J) Information and communication | |||||
| Past activity | 11 | –18 | –8 | –24 | –32 |
| Expected activity | 12 | –6 | –14 | –16 | –13 |
| Expected demand | 12 | –10 | –11 | 0 | –1 |
| Past employment | 7 | –9 | –3 | –7 | –10 |
| Expected employment | 12 | –10 | –10 | –11 | –7 |
| (L) Real estate activities | |||||
| Past activity | 7 | 7 | 0 | –2 | 3 |
| Expected activity | 8 | –1 | 1 | –1 | 0 |
| Expected demand | 2 | –9 | –3 | –4 | –5 |
| Past employment | 3 | 1 | –3 | 1 | –3 |
| Expected employment | 2 | –1 | –5 | –5 | 0 |
| (M) Professional, scientific and technical activities | |||||
| Past activity | –1 | –10 | –14 | –14 | –14 |
| Expected activity | –1 | –13 | –14 | –16 | –13 |
| Expected demand | –5 | –22 | –21 | –21 | –16 |
| Past employment | 1 | 3 | –7 | –4 | –5 |
| Expected employment | 0 | –11 | –7 | –6 | –6 |
| (N) Administrative and support service activities | |||||
| Past activity | 6 | –9 | –8 | –11 | –8 |
| Expected activity | 5 | –9 | –9 | –6 | –5 |
| Expected demand | 3 | –12 | –12 | –8 | 1 |
| Past employment | 8 | –6 | 4 | –6 | 0 |
| Expected employment | 6 | –10 | –5 | 2 | 7 |
- * Average of the balances of opinion since 1988 (2006 for road transport)
Documentation
Methodology (2016) (pdf,158 Ko)
Pour en savoir plus
Time series : Economic outlook surveys – Services