

 28 September 2012
2012- n° 238In Q2 2012, households’ purchasing power increased anew (+0.4% after 0.0%) Quarterly national accounts - detailed figures - 2nd Quarter 2012
28 September 2012
2012- n° 238In Q2 2012, households’ purchasing power increased anew (+0.4% after 0.0%) Quarterly national accounts - detailed figures - 2nd Quarter 2012
In 2012 Q2, as in Q1, French gross domestic product (GDP) in volume* held steady (0.0%).
In 2012 Q2, as in Q1, French gross domestic product (GDP) in volume* held steady (0.0%).
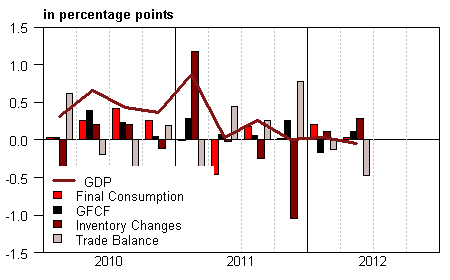
Households’ consumption expenditure remained sluggish (–0.1% after +0.1%). Gross fixed capital formation (GFCF) upturned (+0.5%) after a step back in Q1 (–0.8%). Overall, total domestic demand (excluding changes in inventories) drove GDP on for only 0.1 point of growth in Q2 after a neutral contribution in Q1. Imports accelerated (+1.7% after +0.7%), while exports remained slack (+0.2% after +0.1%). Hence, foreign trade balance still contributed negatively to GDP growth (–0.4 point, after –0.1 point in Q1). Finally, changes in inventories contributed positively to GDP growth: +0.3 point in Q2, after +0.1 point.
Households’ purchasing power renewed with growth
In 2012 Q2, households’ disposable income (HDI) slightly decelerated in nominal terms (+0.5% after +0.6%). This slow down is due to that of compensation of employees (+0.4% après +0.7%), in particular wage per employee. Social benefits in cash also remained dynamic (+0.9%, as in Q1), thanks to pensions’ benefits. Finally, taxes on income and wealth decelerated (+0.5% after +0.9%) after having been buoyed up by new measures in Q1.
graphiqueGraph1 – GDP and its main components
tableauTab1 – GOODS AND SERVICES: SUPPLY AND USES CHAIN-LINKED VOLUMES
| 2011 Q3 | 2011 Q4 | 2012 Q1 | 2012 Q2 | 2011 | 2012 (ovhg) | |
|---|---|---|---|---|---|---|
| GDP | 0.2 | 0.0 | 0.0 | 0.0 | 1.7 | 0.2 |
| Imports | 0.0 | -1.1 | 0.7 | 1.7 | 5.2 | 0.9 |
| Households' consumption expenditure | 0.3 | -0.1 | 0.1 | -0.1 | 0.2 | -0.1 |
| General government's consumption expenditure | 0.2 | 0.2 | 0.5 | 0.4 | 0.2 | 1.1 |
| GFCF | 0.2 | 1.3 | -0.8 | 0.5 | 3.5 | 0.7 |
| of which Non financial corporated and unincorporated enterprises | -0.5 | 1.9 | -1.4 | 0.6 | 5.1 | 0.2 |
| Households | 1.2 | 0.5 | -0.4 | 0.0 | 3.2 | 0.9 |
| General government | 0.4 | 1.0 | -0.1 | 0.9 | -1.8 | 1.5 |
| Exports | 1.6 | 1.4 | 0.1 | 0.2 | 5.5 | 2.2 |
| Contributions : | ||||||
| Internal demand excluding inventory changes | 0.2 | 0.3 | 0.0 | 0.1 | 0.9 | 0.4 |
| Inventory changes | -0.4 | -0.9 | 0.1 | 0.3 | 0.8 | -0.6 |
| Net foreign trade | 0.4 | 0.7 | -0.1 | -0.4 | 0.0 | 0.4 |
tableauTab2 – Sectoral accounts
| 2011 Q3 | 2011 Q4 | 2012 Q1 | 2012 Q2 | 2011 | 2012 (ovhg) | |
|---|---|---|---|---|---|---|
| Profit ratio of NFC* (level) | 28.4 | 28.1 | 27.9 | 28.1 | 28.5 | |
| Household purchasing power | -0.3 | -0.2 | 0.0 | 0.4 | 0.5 | 0.1 |
- *NFC: non-financial corporations
tableauTab3 – GDP and components: prices indices
| 2011 Q3 | 2011 Q4 | 2012 Q1 | 2012 Q2 | 2011 | 2012 (ovhg) | |
|---|---|---|---|---|---|---|
| GDP | 0.3 | 0.5 | 0.3 | 0.5 | 1.3 | 1.3 |
| Imports | 0.8 | 0.8 | 0.7 | -0.6 | 5.4 | 1.3 |
| Cons. Exp.: | ||||||
| - Households | 0.4 | 0.6 | 0.7 | 0.2 | 2.1 | 1.6 |
| - GG* | 0.2 | 0.1 | 0.1 | 0.1 | 1.4 | 0.5 |
| Total GFCF | 0.7 | 0.5 | 0.5 | 0.3 | 2.9 | 1.7 |
| - of which Households | 1.1 | 0.5 | 0.2 | 0.5 | 3.8 | 1.8 |
| - of which NFE | 0.5 | 0.5 | 0.8 | 0.2 | 2.3 | 1.7 |
| - of which GG | 0.7 | 0.8 | 0.5 | 0.2 | 3.6 | 1.8 |
| Exports | 0.3 | 0.4 | 0.6 | -0.4 | 3.2 | 0.8 |
- *GG: General Government
tableauTab4 – Manufactured goods: supply and uses in volume
| 2011 Q3 | 2011 Q4 | 2012 Q1 | 2012 Q2 | 2011 | 2012 (ovhg) | |
|---|---|---|---|---|---|---|
| Industrie’s production | -0.2 | 0.0 | -1.0 | -1.0 | 3.2 | -1.9 |
| - of which value added | -0.4 | -0.7 | -0.7 | -0.7 | 0.7 | -2.1 |
| Imports | -0.3 | -1.4 | 1.6 | 2.4 | 6.7 | 2.2 |
| Intermediate uses | 0.1 | 0.2 | -0.2 | -0.5 | 2.9 | -0.4 |
| Cons. Exp.: | ||||||
| - of households | 0.3 | 0.3 | -0.7 | -0.5 | 0.9 | -1.0 |
| - of GG | 1.2 | 0.6 | 1.8 | 1.3 | 3.6 | 4.0 |
| Total GFCF | -1.2 | 2.6 | -3.4 | 0.5 | 7.3 | -1.8 |
| - of which NFC | -1.5 | 2.8 | -3.8 | 0.6 | 7.6 | -2.1 |
| - of which GG | 0.6 | 0.6 | 0.6 | 0.5 | -0.5 | 1.9 |
| Exports | 1.4 | 1.6 | 1.0 | 0.0 | 4.5 | 3.0 |
| Inventory changes (contribution) | -1.2 | -2.4 | 0.1 | 0.8 | 1.9 | -1.8 |
tableauTab5 – Households’ disposable income and ratios of households’ account
| 2011 Q3 | 2011 Q4 | 2012 Q1 | 2012 Q2 | 2011 | 2012 (ovhg) | |
|---|---|---|---|---|---|---|
| HDI | 0.1 | 0.4 | 0.6 | 0.5 | 2.6 | 1.6 |
| Household purchasing power | -0.3 | -0.2 | 0.0 | 0.4 | 0.5 | 0.1 |
| HDI by cu* (purchasing power) | -0.4 | -0.4 | -0.1 | 0.2 | -0.1 | -0.4 |
| Adjusted HDI (purchasing power) | -0.2 | -0.1 | 0.1 | 0.4 | 0.8 | 0.3 |
| Saving rate (level) | 16.2 | 16.1 | 16.0 | 16.4 | 16.2 | |
| Financial saving rate (level) | 7.1 | 6.9 | 6.8 | 7.2 | 7.1 |
- *cu: consumption unit
tableauTab6 – Ratios of non-financial corporations’ account
| 2011 Q3 | 2011 Q4 | 2012 Q1 | 2012 Q2 | 2011 | |
|---|---|---|---|---|---|
| Profit share | 28.4 | 28.1 | 27.9 | 28.1 | 28.5 |
| Investment ratio | 20.0 | 20.3 | 20.2 | 20.2 | 20.1 |
| Savings ratio | 13.1 | 13.0 | 13.1 | 13.5 | 13.5 |
| Self-financing ratio | 65.5 | 64.2 | 65.0 | 66.9 | 66.9 |
In Q2, consumption prices markedly slowed down (+0.2% after +0.7%), in particular due to petroleum products prices. All in all, households’ purchasing power increased anew (+0.4%) after being stable in Q1. Per consumption unit, it rose by 0.2% in 2012 Q2 after having stepped back for three quarters in a row.
Despite households’ disposable income growth, consumption in nominal terms levelled off (0.0% after +0.8%). As a consequence, households increased their saving for the first time since 2011 Q2. Their savings ratio reached 16.4% after 16.0% in Q1.
Non-financial corporations’ profit ratio upturned after decreasing for six consecutive quarters
Non-financial corporations’ nominal value added accelerated (+0.8% after 0.0%), thanks to a decrease in intermediate consumption prices. Compensations of employees slightly accelerated (+0.4% after +0.2%): wages slowed down (+0.4% after +0.5%) but employers’ social contributions upturned (+0.5% after –0.9%). Besides, taxes on production increased more sharply: +1.1% after +0.1%.
All in all, value added growth has been much higher than that of wages and taxes combined: gross operation surplus of non-financial corporations renewed with growth (+1.6% after –0.9% in Q1). Consequently, non-financial corporations’ profit ratio increased by 0.2% to reach 28.1%. It improved for the first time since 2010 Q3.
GDP growth’s estimation is not revised
With respect to the previous release, (« preliminary figures », 2012 Q2) GDP stagnation’s estimation is confirmed in 2012 Q2 and in two previous quarters. Some components of GDP are revised noticeably (in particular foreign trade of transport equipment). Revisions are due to the integration of data released since then or to the revision of some indicators in the past.