

 20 February 2013
2013- n° 41In february 2013, the business climate is deteriorating in services Monthly survey of services - Fébruary 2013
20 February 2013
2013- n° 41In february 2013, the business climate is deteriorating in services Monthly survey of services - Fébruary 2013
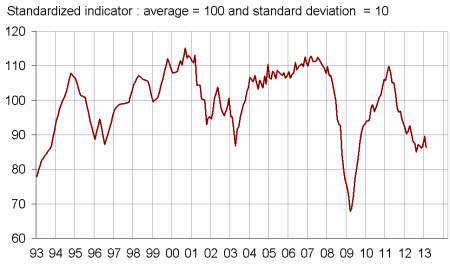
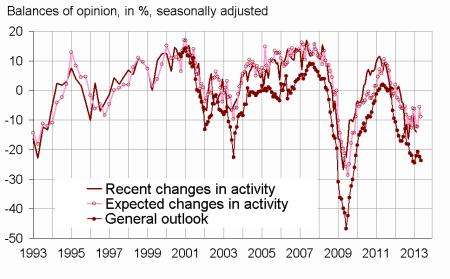
According to the business leaders surveyed in february 2013, the business climate in services was deteriorating. The synthetic indicator dropped by four points and is 86, well below its long-term average. Business leaders consider that activity remained deteriorated over the recent period. Their expectations of activity for the coming months are pessimistic. The general outlook remained well below its long-term average. The turning point indicator tends to indicate a favorable economic situation’s dynamic, however it has to be confirmed in the next months.
According to the business leaders surveyed in february 2013, the business climate in services was deteriorating. The synthetic indicator dropped by four points and is 86, well below its long-term average. Business leaders consider that activity remained deteriorated over the recent period. Their expectations of activity for the coming months are pessimistic. The general outlook remained well below its long-term average. The turning point indicator tends to indicate a favorable economic situation’s dynamic, however it has to be confirmed in the next months.
graphiqueGraph1 – Business climate synthetic indicator
graphiquegraph_retourn – Turning point indicator
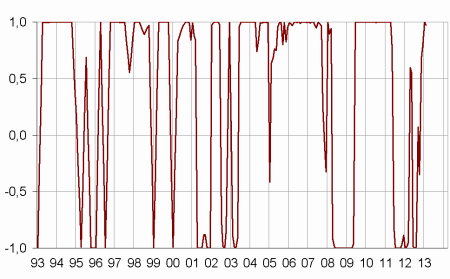
- Note: close to 1 (respectively -1), this indicator indicates a favourable short-term economic situation (respectively unfavourable).
graphiqueGraph2 – Activity
tableauTable_quarter – Economic outlook in the services sector
| Average* | Nov. 12 | Dec. 12 | Jan. 13 | Feb. 13 | |
|---|---|---|---|---|---|
| Business climate synthetic indicator | 100 | 86 | 87 | 90 | 86 |
| General outlook | –6 | –22 | –21 | –22 | –24 |
| Past activity | 3 | –9 | –8 | –13 | –14 |
| Expected activity | 3 | –12 | –12 | –6 | –9 |
| Expected demand | 0 | –13 | –12 | –11 | –13 |
| Business situation | –1 | –15 | –15 | –15 | –15 |
| Past selling prices | –3 | –10 | –9 | –12 | –14 |
| Expected selling prices | –1 | –9 | –9 | –11 | –10 |
| Past employment | 3 | –8 | –7 | –6 | –13 |
| except temporary work agencies | 1 | –6 | –5 | 0 | –4 |
| Expected employment | 2 | –7 | –9 | –9 | –11 |
| except temporary work agencies | 0 | –8 | –9 | –7 | –10 |
| Investments | |||||
| Past investments | 2 | –6 | 1 | 1 | –4 |
| Expected investments | 1 | 0 | 1 | –5 | –6 |
- * Average of the balances of opinion since 1988
- Source: Insee
Documentation
Methodology (2016) (pdf,158 Ko)
Pour en savoir plus
Time series : Economic outlook surveys – Services