

 9 November 2012
2012- n° 275In the manufacturing industry, business managers forecast an investment drop in 2013
after a slight increase in 2012 Industrial investment survey - October 2012
9 November 2012
2012- n° 275In the manufacturing industry, business managers forecast an investment drop in 2013
after a slight increase in 2012 Industrial investment survey - October 2012
Surveyed in October 2012, business managers forecast that investment in the manufacturing industry would slightly increase by 1% in 2012. They revised 4 points downwards their previous expectations given in July 2012. This revision downwards doesn’t concern the manufacture of food products and beverage sector.
For 2012, investment expectations were revised downwards
Surveyed in October 2012, business managers forecast that investment in the manufacturing industry would slightly increase by 1% in 2012. They revised 4 points downwards their previous expectations given in July 2012. This revision downwards doesn’t concern the manufacture of food products and beverage sector.
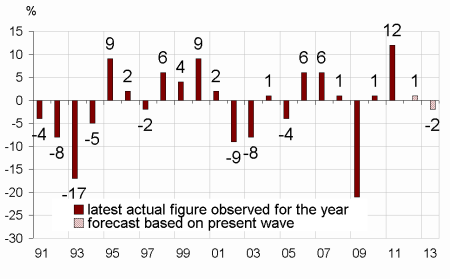
In 2012, the investment increase would be strong in the manufacturing of transport equipment (+9%) with a boom in motor vehicles sector (+25%).
graphiqueGraph1_ang – Annual nominal change in investment in manufacturing industry
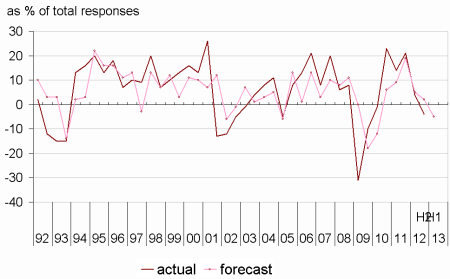
Industrial leaders confirm a decrease in investment in H2 2012
Between H1 and H2 2011, industrial leaders forecast a decrease in their investment, as in last July.
tableauTab1_ang – Real annual investment growth
| NA* : (A17) et [A38] | In 2012 | In 2013 | |
|---|---|---|---|
| forecast Jul.12 | forecast Oct.12 | forecast Oct.12 | |
| C : MANUFACTURING INDUSTRY | 5 | 1 | –2 |
| (C1): Manufacture of food products and beverages | 6 | 6 | –3 |
| (C3): Electrical and electronic equipment; machine equipment | 8 | 0 | 3 |
| (C4): Manufacture of transport equipment | 18 | 9 | 3 |
| [CL1]: Motor vehicles | 27 | 25 | –6 |
| (C5): Other manufacturing | 4 | 0 | –2 |
- How to read this table: In the manufacturing industry, firms surveyed in October 2012 observed a nominal investment increase by 1% in 2012 comparing to 2011 and forecast a decrease by 2% in 2013 comparing to 2012.
- * The codes correspond to the level of aggregation (A17) and [A38] of the "NA" aggregate classification based on NAF rev.2.
graphiqueGraph2_ang – Opinion of industrials regarding six-month change in investment (first estimation*)
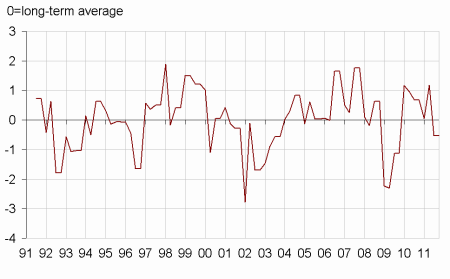
The investment revision indicator becomes negative in October
The investment revision indicator has become negative. Based on investment amounts reported in at each survey by business leaders of the manufacturing industry except those of manufacture of food products and beverages (C1) and of coke and refined petroleum products (C2), this indicator is well-correlated with quarterly growth fixed capital formation of non-financial enterprises. That suggests that investment of these enterprises will decrease at the end of 2012.
graphiqueGraphIR_ang – Investment revision indicator*
In 2013, investment would drop
Surveyed for the first time on their 2013 investment prospects, business leaders forecast a decrease in their investment between H2 2012 and H1 2013.
On average over 2013, they expect a drop by 2% in their equipment spending compared with 2012. In the motor vehicles sector, the investment would drop (–6%) after a boom in 2012 (+25%).
In 2013, the purposes of investment would be similar to those in 2012
According to business leaders in the manufacturing industry, the purposes of investment would be similar in 2013 than to 2012 and close to their averages over the past 20 years.
Half of the investment supports the replacement and modernization of equipment (53%) slightly above its long-term average (+3 points). The share of investment meant to the increase in productive capacity or the introduction of new products (26% in 2013) is slightly lower than its average over the past twenty years (-4 points)
tableauTab2_ang – Share of purposes of investment
| Average | 2012 | 2013 | |
|---|---|---|---|
| 1991-2012 | forecast | forecast | |
| Replacement | 26 | 27 | 30 |
| Modernization, streamlining | 24 | 25 | 23 |
| of which : automation | 11 | 9 | 8 |
| of which : new production methods | 7 | 7 | 7 |
| of which : energy savings | 6 | 9 | 8 |
| increase in productive capacity | 16 | 14 | 14 |
| Introduction of new products | 14 | 13 | 12 |
| Other purposes (safety, environment, working conditions…) | 20 | 21 | 21 |
For 2013, the expected profits from new investment (84%) continue to be the main determinant of investment followed by the technical factors (+68%). The foreign and domestic demand outlooks remain stable at a level below their averages over the past twenty years. The financial factors (cash flow, indebtedness, overall financing conditions) have become less advantageous in 2013 than in 2012. Moreover, business leaders have lowered the impact of other factors (such as tax incentives).
tableauTab3o_ang – Factors influencing investment decisions
| Average | in 2012 | in 2013 | |
|---|---|---|---|
| 1991-2012 | (observation) | (prediction) | |
| Domestic-demand outlook | 50 | 35 | 34 |
| Foreign-demand outlook | 53 | 44 | 45 |
| Expected profits from new investment | 84 | 84 | 84 |
| Cash flow | 16 | 20 | 15 |
| Indebtedness | –4 | 4 | –2 |
| Interest rates | 4 | 14 | 14 |
| Overall financing conditions | 11 | 22 | 15 |
| Technical factors (1) | 64 | 67 | 68 |
| Other factors (such as tax incentives) | 22 | 33 | 27 |
- (1) Technological developments and need for labor to adjust to these new technologies
Documentation
Methodology (pdf,34 Ko)
Pour en savoir plus
Time series : Industry – Investment