

 10 September 2010
2010- n° 219In July, the manufacturing production increased by 1.4% Industrial production index - July 2010
10 September 2010
2010- n° 219In July, the manufacturing production increased by 1.4% Industrial production index - July 2010
In July 2010, the manufacturing production increased by 1.4% in volume. It had decreased by 1.2% in June. In the industry, the production increased also in July (0.9% after -1.7% in June). In the last three months (quarter-on-quarter change), the production rose in the manufacturing sector (+0.7%) as well as in the industry as a whole (+0.8%).
In July 2010, the manufacturing production increased by 1.4% in volume. It had decreased by 1.2% in June. In the industry, the production increased also in July (0.9% after -1.7% in June).
In the last three months (quarter-on-quarter change), the production rose in the manufacturing sector (+0.7%) as well as in the industry as a whole (+0.8%).
In the last three months, the manufacturing production increased by 0.7%…
During the quarter, the production was boosted by the “other manufacturing” (+2.1% q-o-q) and the manufacture of transport equipment (1.1%). However, it decreased in the electrical, electronic equipment and machine equipment (-0.2%) and the manufacture of coke and refined petroleum products (-4.4%).
…and exceeded the last year’s level by 5.9%
The manufacturing production rose by 5.9% (y-o-y).
It soared in the “other manufacturing” (+9.1%) and in the manufacture of transport equipment (+9.2%). It also increased in the electrical and electronic equipment and machine equipment (+2.4%).
Please note: all the data are adjusted for seasonal variations (SA) and the number of days worked (WDA).
graphiqueGraphique1a – Industrial Production indexes
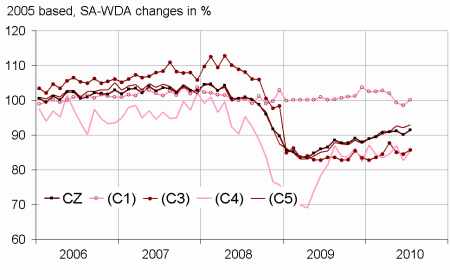
- Legend : CZ : MANUFACTURING - (C1) : Manufacture of food products and beverages - (C3) : Electrical and electronic equipment; machine equipment - (C4) : Manufacture of transport equipment - (C5) : Other manufacturing
- Sources : INSEE, SSP, SOeS
tableauTableau1a – Industrial Production Indexes by activity (NA)
| July / June | June / May | Quarter on quarter change | Year on year change (1) | |
|---|---|---|---|---|
| BE: INDUSTRY | 0,9 | –1,7 | 0,8 | 6,4 |
| CZ: MANUFACTURING | 1,4 | –1,2 | 0,7 | 5,9 |
| (C1): Manufacture of food products and beverages | 1,6 | –0,7 | –3,0 | –1,0 |
| (C2): Manufacture of coke and refined petroleum products | 2,8 | 1,0 | –4,4 | –13,6 |
| (C3): Electrical and electronic equipment; machine equipment | 1,3 | –0,6 | –0,2 | 2,4 |
| (C4): Manufacture of transport equipment | 3,4 | –4,9 | 1,1 | 9,2 |
| (C5): Other manufacturing | 0,9 | –0,6 | 2,1 | 9,1 |
| DE: Mining and quarrying; energy; water supply; waste management | –2,6 | –3,9 | 1,7 | 9,6 |
| FZ: Construction | –1,0 | 0,2 | –0,2 | –3,0 |
- (1) Last three months / three same months of previous year
- The codes correspond to the level of concatenation A 10 (A 17) of the "NA" aggregate classification based on NAF rev.2.
- Sources : INSEE, SSP, SOeS
tableauTableau2a – Industrial Production Indexes
| NA : A10, (A17), [A38 ou A64] | July 2010 | July / June | June / May | Quarter on quarter change |
|---|---|---|---|---|
| BE: INDUSTRY | 92,2 | 0,9 | –1,7 | 0,8 |
| CZ: MANUFACTURING | 91,4 | 1,4 | –1,2 | 0,7 |
| (C1): Man. of food products and beverages | 100,2 | 1,6 | –0,7 | –3,0 |
| (C2): Man. of coke and refined petroleum products | 82,2 | 2,8 | 1,0 | –4,4 |
| (C3): Electrical and electronic equipment; machine equipment | 85,7 | 1,3 | –0,6 | –0,2 |
| [CI] Man. of computer, electronic and optical products | 86,4 | 1,6 | –2,6 | –5,6 |
| [CJ] Man. of electrical equipment | 97,7 | 1,3 | –0,8 | 2,7 |
| [CK] Man. of machinery and equipment n.e.c. (1) | 78,3 | 1,0 | 1,2 | 2,6 |
| (C4): Man. of transport equipment | 85,5 | 3,4 | –4,9 | 1,1 |
| [CL1] Man. of motor vehicles, trailers and semi-trailers | 67,3 | 6,7 | –6,5 | –2,4 |
| [CL2] Man. of other transport equipment | 122,7 | –0,2 | –3,2 | 5,3 |
| (C5): Other manufacturing | 92,9 | 0,9 | –0,6 | 2,1 |
| [CB] Man. of textiles, wearing apparel, leather and related products | 61,3 | 1,2 | –0,5 | –0,2 |
| [CC] Man. of wood and paper products; printing and reproduction of recorded media | 80,1 | –1,6 | –1,2 | –1,9 |
| [CE] Man. of chemicals and chemical products | 108,5 | –1,5 | 0,2 | 1,6 |
| [CF] Man. of basic pharmaceutical products and pharmaceutical preparations | 139,2 | 2,4 | 0,5 | 1,9 |
| [CG] Man. of rubber and plastics products, and other non-metallic mineral products | 82,9 | 0,5 | –1,1 | 1,0 |
| [CH] Man. of basic metals and fabricated metal products, except machinery and equipment | 80,8 | 0,7 | –1,6 | 2,6 |
| [CM] Other manufacturing; repair and installation of machinery and equipment | 108,3 | 3,0 | –0,6 | 5,5 |
| DE: Mining and quarrying; energy; water supply; waste management | 97,9 | –2,6 | –3,9 | 1,7 |
| [BZ] Mining and quarrying | 94,3 | 3,2 | 1,2 | 6,4 |
| [DZ] Electricity, gas, steam and air-conditioning supply | 98,3 | –3,3 | –4,4 | 1,9 |
| [EZ] Water supply; sewerage, waste management and remediation | 97,7 | 0,9 | –2,5 | –2,6 |
| FZ: Construction | 93,3 | –1,0 | 0,2 | –0,2 |
| MIGs (2) | ||||
| Capital goods | 86,4 | 2,6 | –2,0 | 2,7 |
| Intermediate goods | 84,9 | 0,5 | –1,4 | 0,6 |
| Consumer durables | 78,4 | 0,8 | –3,3 | 0,2 |
| Consumer non-durables | 105,4 | 1,4 | –0,2 | –1,0 |
- (1) n.e.c. : not elsewhere classifiable
- (2) Main industrial groupings : definition in Commission regulation EC of 14 June 2007
- Sources : Insee, SSP, SOeS
In July, the production increased in the « other manufacturing » (+0.9 %)…
The production increased in the other manufacturing; repair and installation (+3.0%) and in the basic pharmaceutical products and pharmaceutical preparations (+2.4%). It also increased in the manufacture of rubber and plastics products, and other non-metallic mineral products (+0.5%) and in the manufacture of textiles, wearing apparel, leather and related products (+1.2%). The production decreased in the manufacture of chemicals and chemical products (–1.5%) and in the manufacturing of wood and paper products ; printing and reproduction of recorded media (-1.6%).
…in the manufacture of transport equipment (+3.4 %)…
In July, the production increased in the manufacture of motor vehicles, trailers and semi-trailers (+6.7 %). On the opposite, it slightly decreased in the manufacture of other transport equipment (–0.2 %).
… and in the electrical or electronic equipment and the machine equipment (+1.3 %)
The production increased in the manufacture of computer, electronic and optical products (+1.6 %), in the manufacture of machinery and equipment n.e.c. (+1.0%) and in the manufacture of electrical equipment (+1.3%).
Revisions
The SA-WDA evolution between May and June of the manufacturing production published during the previous campaign was -1.3 %. It has been revised at -1.2 %. The raw data revisions are attributable to industries‘ belated answers, especially in the manufacture of computer, electronic and optical products, the electrical equipment and the manufacture of basic pharmaceutical products and pharmaceutical preparations.
tableauTableau3a – Measure of variations’ revisions
| June / May | May / April | April / March | Q2 2010 / Q1 2010 | 2009 / 2008 | |
|---|---|---|---|---|---|
| Industry (BE) | 0,00 | –0,22 | 0,11 | 0,00 | –0,03 |
| raw serie | –0,13 | 0,11 | 0,00 | 0,07 | –0,02 |
| SA-WDA coefficient | 0,13 | –0,33 | 0,11 | –0,07 | –0,01 |
| Manufacturing (CZ) | 0,11 | –0,22 | –0,11 | –0,08 | –0,04 |
| raw serie | –0,12 | 0,00 | –0,09 | –0,08 | –0,01 |
| SA-WDA coefficient | 0,23 | –0,22 | –0,02 | 0,00 | –0,03 |
- Note of reading : in the manufacturing, the SA-WDA evolution between May and June is revised by 0.11 point : -0.12 is due to the raw serie's revision and +0.23 to the new calculation of the SA-WDA.
- Sources : Insee, SSP, SOeS
Documentation
Methodology (pdf,163 Ko)