

 12 May 2010
2010- n° 126According to business managers, investment would increase by 6% in manufacturing industry Industrial investment survey - April 2010
12 May 2010
2010- n° 126According to business managers, investment would increase by 6% in manufacturing industry Industrial investment survey - April 2010
Surveyed in April 2010, business managers state that investment in manufacturing industry dropped in 2009 comparing to 2008: –23%.

Warning: Business surveys are now published according to the French economic activities and products classification, NAF rev. 2.
Surveyed in April 2010, business managers state that investment in manufacturing industry dropped in 2009 comparing to 2008: –23%.
graphiqueGraph1_ang – Annual nominal change in investment in manufacturing industry
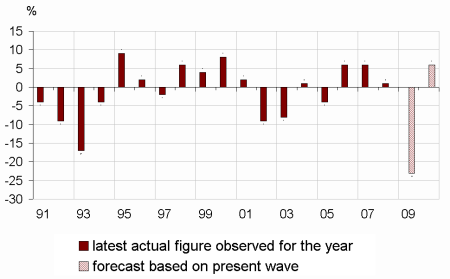
Investment would rebound in 2010
For 2010, prospects are more favourable: business leaders in manufacturing industry forecast a rebound of 6% in their equipment expenditures. They revised 1 point upwards their previous forecasts declared last January. The rebound in investment would be important in the sector of electrical, electronic equipment and machine equipment (+5% in 2010 after –25% in 2009) and in other manufacturing’s sectors such as manufacture of textiles and wearing apparel, leather and related products, manufacture of chemicals and chemical products, manufacture of rubber and plastics products, and other non-metallic mineral product and manufacture of basic metals and fabricated metal products. On the other hand, investment is expected to stabilize in the sector of motor vehicles.
tableauTab1_ang – Real annual investment growth
| NA* : (A17) and [A38] | 2009 | 2010 | ||
|---|---|---|---|---|
| estimate Jan.10 | observed Apr.10 | estimate Jan.10 | estimate Apr.10 | |
| MANUFACTURING INDUSTRY | –25 | –23 | 5 | 6 |
| (C1): Manufacture of food products and beverages | –17 | –14 | –2 | –5 |
| (C3): Electrical and electronic equipment; machine equipment | –27 | –25 | –2 | 5 |
| (C4): Manufacture of transport equipment | –13 | –15 | 2 | 1 |
| [CL1]: Motor vehicles | –22 | –24 | 3 | –1 |
| (C5): Other manufacturing | –30 | –28 | 5 | 6 |
- How to read this table: In manufacturing industry, firms surveyed in April 2010 observed drop of 23% of their nominal investment in 2009 comparing to 2008 and forecast an increase of 6% in 2010 comparing to 2009.
- * The codes correspond to the level of aggregation (A17) and [A38] of the "NA" aggregate classification based on NAF rev.2.
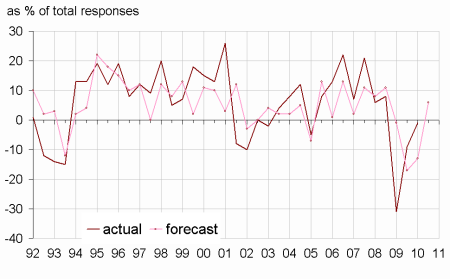
Investment would accelerate between the first half and the second half 2010
Business leaders in manufacturing industry are stating that investment stabilized in the first half of 2010 comparatively to the second half of 2009. They anticipate an increase of their investment in the second half of 2010 comparatively to the first half of 2010.
graphiqueGraph2_ang – Six-month change in investment (first estimate in April and October)
In 2010, the proportion of investment for replacement and energy savings would still be important
According to business leaders in manufacturing industry, in 2010 the share of purposes of investment would be the same than in 2009. The proportion of investment for replacement (28%) and for energy savings (9%) would be more important than the long-term averages (respectively 26% and 5%). On the contrary, the proportion of investment for automation (8% in 2009 and in 2010, vs 12% on average) and for increase in productive capacity (15% in 2009 and 14% in 2010, vs 16% on average) would be less important.
tableauTab2_ang – Share of purposes of investment
| Average | 2009 | 2010 | |
|---|---|---|---|
| 1991-2008 | forecast | forecast | |
| Replacement | 26 | 28 | 28 |
| Modernisation, streamlining | 24 | 23 | 23 |
| of which: automation | 12 | 8 | 8 |
| of which: new production methods | 7 | 6 | 6 |
| of which: energy savings | 5 | 9 | 9 |
| increase in productive capacity | 16 | 15 | 14 |
| Introduction of new products | 14 | 13 | 14 |
| Other purposes (safety, environnement, working conditions…) | 20 | 21 | 21 |
For 2010, business leaders in manufacturing industry are less pessimistic concerning the change in productive capacity: the corresponding balance of opinion is higher than the balance of opinion for 2009. Nevertheless, this balance of opinion is lower than its long-term average.
According to forecastings of business leaders, 64% of enterprises are expected to report equipement scrapping in 2010, after 67% in 2009 and 78% in average. The rate of equipement scrappings for wear and tear and obsolescence would increase by 2 points at 54%; on the other hand, the rate of equipement scrapping for shut-down of capacity for old products would decrease to 15%.
tableauTab3a_ang – Productive capacity and equipment scrapping
| Observed | Forecast | |||
|---|---|---|---|---|
| aver. | in 2009 | aver. | for 2010 | |
| Change in productive capacity* | 33 | 15 | 34 | 20 |
| Change in equipment scrapping* | 20 | 15 | –3 | –13 |
| Share of enterprises reporting equipment scrapping* | 78 | 67 | 77 | 64 |
| Breakdown of enterprises reporting equipement scrapping** | ||||
| Wear and tear, obsolescence | 50 | 52 | 48 | 54 |
| Installation of more efficient equipment | 32 | 27 | 34 | 28 |
| Shut-down of capacity for old products | 12 | 17 | 11 | 15 |
| Other scrapping | 6 | 4 | 7 | 3 |
| Total | 100 | 100 | 100 | 100 |
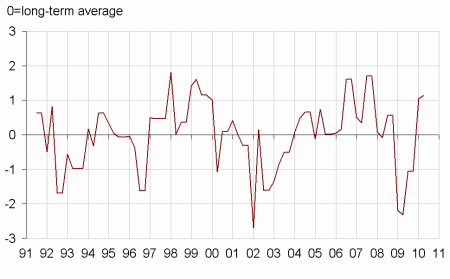
Revision indicator still positive
Revision indicator is still positive. This suggests that investment will increase during the second quarter. In fact, based on investment amounts filled in at each survey, this indicator is well-correlated with quarterly growth of gross fixed capital formation of non-financial enterprises.
graphiqueGraphIR_ang – Investment revision indicator *
Documentation
Methodology (pdf,34 Ko)
Pour en savoir plus
Time series : Industry – Investment