

 18 December 2015
2015- n° 318In November 2015, overall agricultural producer prices decreased by 0.7% Indices of agricultural prices - November 2015
18 December 2015
2015- n° 318In November 2015, overall agricultural producer prices decreased by 0.7% Indices of agricultural prices - November 2015
In November 2015, overall agricultural prices fell back compared with the previous month (–0.7%). Over one year, they dropped by 0.3%.
In November 2015, overall agricultural prices fell back compared with the previous month (–0.7%). Over one year, they dropped by 0.3%.
Moderate increase in cereals prices and oleaginous prices
Cerales prices kept on rallying in November (+1.7% compared to October, after +5.4% the previous month). With the decline in euro, the French exporters benefitted from more attractive prices, in particular towards their competitors in the Black Sea region.
graphiquecereal – Producer prices of cereals
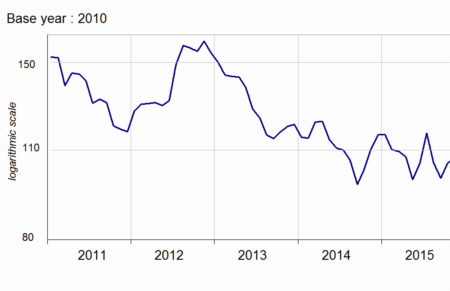
- Source: INSEE
The depreciation in euro also drove upward oleaginous prices, as they increased by 1.7%. In addition, sunflower prices were up due to weak crop, combined with a sustained demand from the grinding industry. Over one year, oleaginous prices surged by 15.0% following the drop in world wide rape crop, the main seed growed in France.
Jump in potatoes prices year-over-year
Compared to November 2014, potatoe prices increased by nearly 50 % yoy. The 2015 crop reached its long-term average whereas the previous one was exceptional.
Over one year, fresh fruit prices rose and vegetables prices fell
Fresh fruit prices increased yoy (+7.0%). Apples were sold easily through exportations, toward Asia in particular. The rise in pear prices reflected a downturn in the supply: the autumn varieties were scarce despite the presence in this market of Belgium and the Netherlands.
graphiquevegetable – Producer prices of fresh vegetables
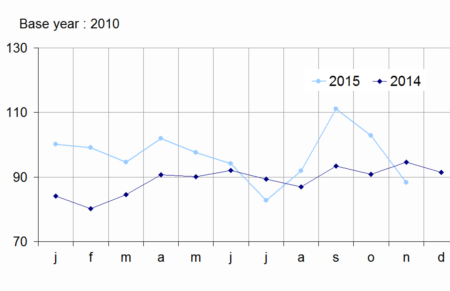
- Source: SSP (ministry in charge of agriculture)
Fresh vegetables prices diminished yoy (–6.7 %). In particular, lettuces and tomatoes prices fell. However, compared to last year, the consumers favoured the seasonal vegetables, noticeably carots and leeks, whose prices surged.
Slide in overall animal prices
On a seasonally adjusted basis, prices of animals decreased in November (–1.2%). Pig prices plunged again (–5.0%) : the excess supply was fueled by the foreign competition noticeably from Spain. Calves prices gained 8.5% over the quarter due to the decrease in slaughters.
graphiquepig – Producer prices of pigs and large cattle
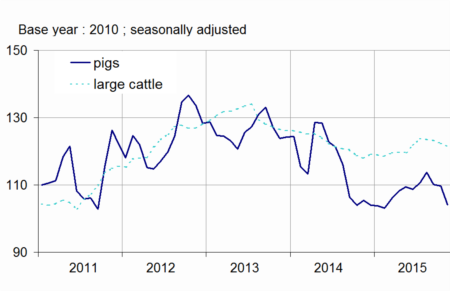
- Source: INSEE
tableauTab1 – Indices of producer prices of agricultural products (IPPAP)
| Weights | Nov. 2015 | Variation as % over | |||
|---|---|---|---|---|---|
| a month | 3 months | a year | |||
| raw | Seasonally adjusted | raw | |||
| Agricultural goods output | 1000 | 112.1 | –0.7 | +1.5 | –0.3 |
| excluding fruits and vegetables | 900 | 113.4 | +0.3 | +1.5 | –0.2 |
| Crop output (excluding fruits and vegetables) | 505 | 117.2 | +0.9 | +3.4 | +2.4 |
| Cereals | 188 | 106.8 | +1.7 | +1.6 | –3.2 |
| of which soft wheat | 112 | 104.4 | +3.7 | +6.9 | –1.8 |
| grain maize | 41 | 98.9 | +1.9 | –1.6 | +12.0 |
| Potatoes | 26 | 142.6 | /// | /// | +49.1 |
| Wines | 177 | 131.2 | +1.2 | +2.5 | +0.5 |
| Protected designation of origin | 84 | 137.7 | +2.5 | +4.7 | +0.4 |
| other wines | 23 | 147.9 | –1.0 | –0.4 | +1.1 |
| Oleaginous | 49 | 104.6 | +1.7 | +4.0 | +15.0 |
| Horticultural products | 30 | 111.5 | –1.3 | +2.0 | +3.1 |
| Other crop products | 36 | 106.9 | +0.1 | –1.0 | –0.5 |
| Fruits and vegetables (1) | 100 | 100.3 | /// | /// | –1.0 |
| Fresh vegetables | 53 | 88.2 | /// | /// | –6.7 |
| Fresh fruits | 35 | 114.7 | /// | /// | +7.0 |
| Animal output | 395 | 108.4 | –0.6 | –1.0 | –3.7 |
| Animals | 234 | 112.0 | –1.2 | –1.7 | +0.9 |
| of which large cattle | 96 | 118.7 | –0.6 | –1.6 | +3.1 |
| calves | 26 | 108.7 | +3.3 | +8.5 | –0.7 |
| pigs | 54 | 101.0 | –5.0 | –8.4 | –1.2 |
| sheep | 10 | 117.1 | –3.6 | –0.5 | –4.3 |
| poultry | 46 | 111.7 | –0.2 | +1.0 | +0.6 |
| of which chicken | 28 | 111.8 | –0.3 | +1.0 | +1.0 |
| Milk | 147 | 100.9 | 0.0 | +0.2 | –10.9 |
| of which cow milk (2) | 137 | 99.7 | 0.0 | +0.2 | –11.8 |
| Eggs | 15 | 125.7 | +4.4 | –0.3 | –2.7 |
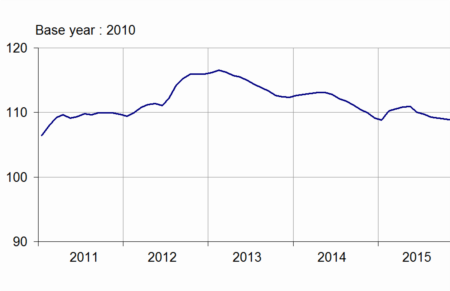
Purchase prices of means of production was practically stable in November
In November 2015, intermediate consumption prices fell slightly compared to the previous month (–0.2 %). Over one year, they fell by 1.6%, mostly reflecting the slump in energy prices (–13.8%). Capital goods prices were virtually stable. Over one year, they increased by 0.8%, driven up by the rise in material prices (+1.2 %).
graphiquemeans – Purchase prices of the means of agricultural production
tableauTab2 – Indices of purchase prices of the means of agricultural production (IPAMPA)
| Weights | Nov. 2015 | Variation as % over | |||
|---|---|---|---|---|---|
| a month | 3 months | a year | |||
| Total input | 1000 | 108.8 | –0.1 | –0.5 | –1.1 |
| Intermediate consumptions | 764 | 109.6 | –0.2 | –0.5 | –1.6 |
| Energy | 100 | 94.4 | –0.1 | –0.3 | –13.8 |
| Seeds | 57 | 109.6 | –0.1 | +0.6 | +1.3 |
| Fertilisers and soil improvers | 92 | 116.4 | –0.2 | –0.5 | –0.1 |
| Plant protection products | 78 | 100.5 | –0.2 | –0.1 | –0.7 |
| Animal feed | 205 | 116.2 | –0.4 | –1.6 | –0.3 |
| Veterinary expenses | 43 | 115.1 | –0.1 | +0.1 | +2.5 |
| Small equipment and tools | 17 | 109.2 | –0.2 | –0.5 | –0.4 |
| Maintenance of materials | 67 | 113.4 | –0.1 | 0.0 | +1.6 |
| Maintenance of buildings | 9 | 107.0 | 0.0 | 0.0 | +0.1 |
| Other goods and services | 97 | 101.3 | –0.2 | –0.2 | –0.5 |
| Goods and services contributing to investment | 236 | 106.7 | +0.1 | –0.2 | +0.8 |
| Material | 186 | 107.4 | +0.1 | –0.2 | +1.2 |
| Tractors | 79 | 107.2 | +0.3 | –0.4 | +1.5 |
| Machinery and plant for cultivation | 36 | 109.2 | –0.2 | –0.3 | +1.1 |
| Machinery and plant for harvesting | 42 | 107.9 | +0.1 | +0.1 | +1.1 |
| Utility vehicles | 18 | 105.1 | +0.5 | +0.2 | +0.7 |
| Buildings | 50 | 104.1 | 0.0 | 0.0 | –0.8 |
- (1) The repayment of the domestic tax on energy products (TICPE) benefiting farmers has been applied in advance for the year 2015
- Sources: INSEE - SSP (ministry in charge of agriculture)
Documentation
Methodology (pdf,122 Ko)
Pour en savoir plus
Time series : Indices of agricultural prices