

 Wages are both more dynamic and more widely dispersed in Germany than in France
Since 2012, German wages have risen faster than French wages. Before this, from 2000 to 2007, the change was more moderate in Germany than in France. Then from 2008 to 2011, the situation was similar on both sides of the Rhine. In 2014, in enterprises of 10 or more employees in industry and market services, average gross hourly wages in Germany (17.8 euros) and France (17.9 euros) were similar. However, wage differentials by sector, type of contract and occupation are more pronounced in Germany than in France.
Wages more dynamic in Germany than in France since 2012
Various indicators can be used (figure 1) to compare wage dynamics in France and Germany. All of them converge towards a common finding: compared with France, wages in Germany increased at a more moderate rate from 2000 to 2007, at a similar pace from 2008 to 2011, then more strongly since 2012. The change in Germany was affected mainly by the implementation of the Ouvrir dans un nouvel ongletHartz reforms between 2003 and 2005. These resulted in strong wage moderation in Germany from 2003 onwards. Wage negotiations subsequently contributed to higher wage rises.
One of the first indicators is gross hourly wage. Between 2000 and 2007, in the non-farm market sector (except services to households), it increased by 2.1% per year on average in Germany, against 3.3% in France, according to the Ouvrir dans un nouvel ongletLabour Cost Index – wages and salaries which covers all forms of employment (including mini-jobs and apprenticeships). From 2008 to 2011, annual growth was very similar. From 2012 to 2015, the average rise was 2.3% in Germany and 1.8% in France.
Differences in either direction are even more marked when gross average wage per capita is considered. This indicator is derived from the national accounts, and includes all types of pay (bonuses, overtime payments, etc.) and the percentage of time employees work, and it confirms this observation. From 2012 to 2015, the average wage per capita increased by 1.4% on an average annual basis in France, against 2.7% in Germany. Other frequently used indicators also confirm this observation. The basic monthly wage slowed in France (+1.6% on average from 2012 to 2015 against +2.5% between 2000 and 2007), whereas in Germany the index of agreed earnings accelerated (+2.7% per year between 2012 and 2015 against +2.0% between 2000 and 2007).
The measure of gross wages only can be supplemented by comparing the labour cost, which in addition to wages, includes associated contributions (taxes paid minus subsidies based on wages,employer social contributions, training). Since 2012, the Ouvrir dans un nouvel ongletLabour Cost Index – total labour cost in France has slowed significantly more than the Ouvrir dans un nouvel ongletLabour Cost Index - wages and salaries: it increased by 1.2% on average per year compared with 3.4% between 2000 and 2007. The tax credit for encouraging competitiveness and jobs (CICE) and measures in the Responsibility and Solidarity Pact to reduce employer contributions have played a major part in this slowdown.
tableauFigure 1 - Annual average change in wages in France and Germany, using different indicators
| Indicators | Country | 2000-2007 | 2008-2011 | 2012-2015 | 2000-2015 |
|---|---|---|---|---|---|
| Labour Cost Index - wages and salaries | Germany | 2,1 | 2,3 | 2,3 | 2,2 |
| France | 3,3 | 2,4 | 1,8 | 2,7 | |
| Labour Cost Index - total labour cost | Germany | 1,9 | 2,3 | 2,3 | 2,1 |
| France | 3,4 | 2,5 | 1,2 | 2,6 | |
| Average gross wage per capita | Germany | 1,3 | 1,8 | 2,7 | 1,8 |
| France | 3,2 | 2,1 | 1,4 | 2,5 | |
| Indice of agreed earnings | Germany | 2,0 | 2,4 | 2,7 | 2,3 |
| Basic monthly wage | France | 2,5 | 2,3 | 1,6 | 2,2 |
- Note: since the change in wages from collective agreements in Germany was not available across the whole sector pre-2006, the change for industrial activities and construction was used.
- How to read the table: the Labour Cost Index - wages and salaries increased in Germany by an average of 2.1% annually for the period 2000-2007 against 3.3% per annum in France.
- Scope: Business economy: non-agricultural market sector excluding services to households (sections B to N of NACE rev. 2).
- Sources: Eurostat, INSEE, DESTATIS, Labour cost index; INSEE, DESTATIS, National accounts; DARES, Basic monthly wage, from the quarterly ACEMO survey; DESTATIS, Indice of agreed earnings.
More wage disparities in Germany than in France…
From one industry to another, the dispersion of average hourly gross wages is greater in Germany than in France among enterprises of 10 or more employees, according to the Ouvrir dans un nouvel ongletStructure of Earnings Survey. For example, in 2014 the average hourly wage in Germany varied from 9.8 euros in accommodation and food services to 27.4 euros in energy production and distribution, i.e. almost three times as much (figure 2). This hierarchy of industries is also found in France, but is less pronounced: the average gross hourly wage in accommodation and food services (13.0 euros) is around half that in the production and distribution of energy (24.1 euros). In addition, between 2010 and 2014, while the wage range narrowed in France, it widened slightly in Germany over the same period.
tableauData Figure 2 - Average gross hourly wage by sector of activity in France and Germany in 2014
| Germany | France | |
|---|---|---|
| Electricity, gas, steam and air conditioning supply | 27,4 | 24,0 |
| Financial and insurance activities | 24,9 | 23,6 |
| Information and communication | 23,8 | 23,0 |
| Professional, scientific and technical activities | 22,2 | 22,3 |
| Mining and quarrying | 21,7 | 18,4 |
| Manufacturing | 20,9 | 17,8 |
| Real estate activities | 18,1 | 16,9 |
| All: business economy | 17,8 | 17,9 |
| Water supply; sewerage, waste management and remediation activities | 17,0 | 15,8 |
| Construction | 15,7 | 16,4 |
| Wholesale and retail trade; repair of motor vehicles and motorcycles | 15,3 | 15,8 |
| Transportation and storage | 14,5 | 17,4 |
| Administrative and support service activities | 12,0 | 14,2 |
| Accommodation and food service activities | 9,8 | 13,0 |
- How to read the table: all types of contract combined, in business economy, the average hourly wage was 17.8 euros in France and 17.9 euros in Germany in 2014.
- Scope: Business economy: non agricultural market sector excluding services to households, enterprises with 10 or more employees.
- Sources: Eurostat, INSEE DESTATIS, SES 2014.
graphiqueFigure 2 - Average gross hourly wage by sector of activity in France and Germany in 2014

- How to read the table: all types of contract combined, in business economy, the average hourly wage was 17.8 euros in France and 17.9 euros in Germany in 2014.
- Scope: Business economy: non agricultural market sector excluding services to households, enterprises with 10 or more employees.
- Sources: Eurostat, INSEE DESTATIS, SES 2014.
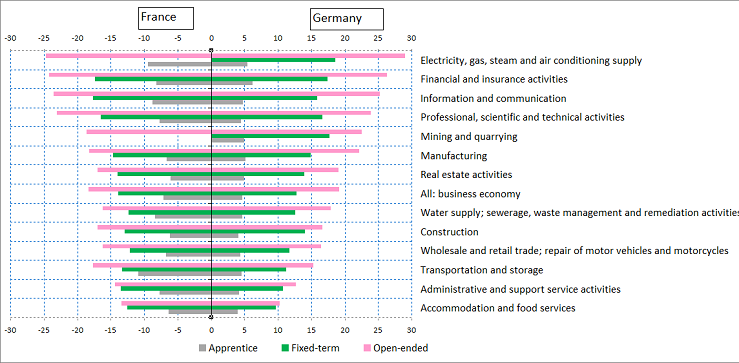
The dispersion of gross hourly wages is also greater in Germany according to type of contract (figure 3). German employees with fixed-term contracts earn on average 34% less than those with open-ended contracts, whereas this gap is 24% in France. Overall, employees on open-ended contracts are better paid in Germany than in France (19.5 euros on average against 18.3 euros); the reverse is true for fixed-term contracts.
tableauData Figure 3 - Average gross hourly wage by type of work contract and industry / economic activity in France and Germany in 2014
| Activities | Germany | France | ||||
|---|---|---|---|---|---|---|
| Apprentice | Fixed-term | Open-ended | Apprentice | Fixed-term | Open-ended | |
| Accommodation and food services | 3,9 | 9,6 | 10,2 | 6,3 | 12,5 | 13,4 |
| Administrative and support service activities | 4,1 | 10,7 | 12,6 | 7,7 | 13,5 | 14,3 |
| Transportation and storage | 4,5 | 11,2 | 15,2 | 10,9 | 13,3 | 17,6 |
| Wholesale and retail trade; repair of motor vehicles and motorcycles | 4,3 | 11,6 | 16,4 | 6,7 | 12,1 | 16,2 |
| Construction | 4,0 | 14,0 | 16,6 | 6,1 | 12,9 | 17,0 |
| Water supply; sewerage, waste management and remediation activities | 4,6 | 12,5 | 17,8 | 8,4 | 12,3 | 16,2 |
| All: business economy | 4,6 | 12,7 | 19,1 | 7,1 | 13,9 | 18,3 |
| Real estate activities | 4,9 | 13,9 | 19,0 | 6,0 | 14,0 | 17,0 |
| Manufacturing | 5,1 | 14,8 | 22,1 | 6,6 | 14,6 | 18,2 |
| Mining and quarrying | 4,9 | 17,6 | 22,5 | 0,0 | 0,0 | 18,6 |
| Professional, scientific and technical activities | 4,4 | 16,6 | 23,8 | 7,7 | 16,5 | 23,0 |
| Information and communication | 4,7 | 15,8 | 25,2 | 8,7 | 17,6 | 23,5 |
| Financial and insurance activities | 6,1 | 17,3 | 26,2 | 8,2 | 17,3 | 24,2 |
| Electricity, gas, steam and air conditioning supply | 5,4 | 18,5 | 28,9 | 9,4 | 0,0 | 24,7 |
- How to read the table: in Electricity, gas, steam and air conditioning supply, the average hourly wage of employees with an open-ended contract was 24.7 euros in France and 28.9 euros in Germany.
- Scope: Business economy: non agricultural market sector excluding services to households, enterprises with 10 or more employees.
- Sources: Eurostat, INSEE, DESTATIS, SES 2014.
graphiqueFigure 3 - Average gross hourly wage by type of work contract and industry / economic activity in France and Germany in 2014
- Scope: Business economy: non agricultural market sector excluding services to households, enterprises with 10 or more employees.
- How to read the table: in Electricity, gas, steam and air conditioning supply, the average hourly wage of employees with an open-ended contract was 24.7 euros in France and 28.9 euros in Germany.
- Sources: Eurostat, INSEE, DESTATIS, SES 2014.
... resulting in greater disparities between groups of occupations
Gross hourly wages by group of occupations are similar, on average, in the two countries but are nevertheless more dispersed in Germany than in France. In 2014, the wages of managers and professionals were 1.9 times higher than the average German wage, against 1.6 times higher in France (figure 4). In contrast, low-skilled, or elementary occupations earned around 50% of the average wage in Germany, compared with 70% in France. While this ratio has remained stable in France, it has decreased in Germany (70% in 2006).
tableauFigure 4 - Average hourly wage in France and Germany by group of occupations in 2006 and 2014
| Business economy | All occupations (in euros) | of which: | ||||
|---|---|---|---|---|---|---|
| Managers and professionals | Elementary occupations | |||||
| 2014 | 2006 | 2014 | 2006 | 2014 | 2006 | |
| Germany | 17,8 | 16,1 | 33,0 | 29,8 | 9,8 | 10,8 |
| France | 17,9 | 15,5 | 28,8 | 26,3 | 12,0 | 10,4 |
| Average German wage / average French wage | 1,0 | 1,0 | 1,1 | 1,1 | 0,8 | 1,0 |
| German wage for occupation / average German wage | 1,0 | 1,0 | 1,9 | 1,8 | 0,5 | 0,7 |
| French wage for occupation / average French wage | 1,0 | 1,0 | 1,6 | 1,7 | 0,7 | 0,7 |
- Note: groups of occupations are defined using the European classification ISCO (ISCO=1 and 2: managers and professionals; ISCO 9: elementary occupations).
- How to read the table: in 2014, the average wage of managers and professionals in Germany was 1.9 times higher than the average German wage.
- Scope: Business economy: non agricultural market sector excluding services to households, enterprises with 10 or more employees.
- Sources: Eurostat, INSEE, DESTATIS, SES 2006 and 2014.
Is there a move towards a reduction in wage disparities in Germany?
On 1st January 2015, in order to limit wage disparities which were tending to increase, the German government introduced a minimum gross fixed hourly wage of 8.5 euros. This measure did not have any clear impact on wages immediately. Indeed, in many collective agreements standard minimum wages of more than 8.5 euros were already applied. In other branches, only employees not covered by a collective agreement were concerned by this measure at the beginning of 2015, as many industries had arranged to delay implementation until the end of 2016. Ultimately, the creation of a minimum wage could help reduce wage disparities in Germany.
Sources
This study used data available on the Eurostat website produced by France (INSEE or DARES) and Germany (DESTATIS).
Labour Cost Indices are calculated by INSEE and DESTATIS based on national sources. The average wage per capita is calculated in the framework of the national accounts. For these indicators, DESTATIS uses mainly the quarterly earnings survey involving 40,500 business establishments with 10 or more employees, in the non agricultural market sector.
The basic monthly wage is calculated by DARES from the Labour Activity and Employment Conditions Survey (ACEMO). In Germany, the Indices of agreed earnings (Ouvrir dans un nouvel ongletISCC) is constructed from a survey covering the 600 largest collective agreements in terms of number of employees (minimum of 75% of the branch) in enterprises of 10 or more employees in the non agricultural market sector excluding services to households. This standard basic wage (excluding bonuses), like the basic monthly wage, is calculated using a constant qualification structure.
The study used the Ouvrir dans un nouvel ongletStructure of Earnings Surveys (SES) produced by INSEE and DESTATIS respectively for gross hourly wages.
Définitions
Wages and salaries are the payment for work agreed between an employee and his or her employer under the contract of employment in the private sector and for contractual agents in the public service, or employment for civil servants.
It includes the basic salary (or index-linked salary in the civil service) but also bonuses and allowances, compensation for overtime hours worked, employee savings (mandatory or optional profit-sharing, additional matching contributions), other indemnities and related compensations (residence allowance, family allowance, etc.) and payments in kind.
The salary is a kind of "price". Reduced to a unit of volume of work, which can be an hour (hourly wage) or a full-time equivalent (FTE wage), it enables jobs or work stations of different duration and working time to be compared.
The annual analysis of wages enlists several sources constructed from social declarations or administrative data. Information about the private sector comes from the nominative social declarations (DSN), which follow the annual declarations of social data (DADS). Since 2009, information about the civil service has come from the information system on public service employees (Siasp), fed mainly by the State's monthly pay files for civil servants in the State civil service (SCS) and by the DADS, then by the DSN, for those in the local civil service (LCS), in the hospital civil service (HCS) and in some public establishments falling under the SCS.
These administrative sources are supplemented by two statistical surveys : the INSEE survey on labour costs and structure of earnings (Ecmoss) and the DARES survey on labour activity and employment conditions (Acemo).
The average per capita wage (SMPT) refers to the gross wage bill paid by all employers to the number of employees in physical persons.
The evolution of the SMPT reflects the evolution of qualifications and the share of work (structural effects) and that of overtime and bonus pay (seasonal and cyclical effects).
Quarterly average wage per capita is calculated by the National Accounts using the
payrolls (bases of contributions) provided each quarter by the central agency of social
security bodies (Acoss) and employment estimates for the workforce. The bases of contributions
cover virtually all remuneration, including bonuses and overtime, but not employee
savings (profit-sharing...).
The basic monthly wage corresponds to an employee's gross wage before deduction of any form of contribution (social security, unemployment insurance, supplementary pension, provident fund, CSG, CRDS). It does not include bonuses or remuneration received for overtime (for full-time employees) or additional hours (for part-time employees). Its amount generally corresponds to the figure given on the first line of an employee's pay slip.
Pour en savoir plus
Chagny O., Lainé F., « Ouvrir dans un nouvel ongletComment se comparent les salaires entre la France et l'Allemagne ? », Note d'analyse de France Stratégie, 2015.
Chagny O., Le Bayon S., « Ouvrir dans un nouvel ongletL'introduction d'un salaire minimum légal : genèse et portée d'une rupture majeure », Chronique internationale de l'Ires n° 146, 2014.
« In 2014, the basic monthly wage continued to increase more in Germany than in France », Informations rapides INSEE, 2015.
Kramarz F., Spitz-Oener A., Senftleben C., Zwiener H., « Ouvrir dans un nouvel ongletLes mutations du marché du travail allemand », Les rapports du Conseil d’analyse économique, la Documentation française, 2012.
Luciani A., « The cost of labour since the economic crisis: contrasting trends in Europe », Insee Focus n° 17, February 2015.
« Ouvrir dans un nouvel ongletEmployment Outlook 2016 », OECD Publishing, Paris, 2016.
