

 29 January 2016
2016- n° 31Despite a rebound in December (+0.7%), household consumption of goods declined over
the fourth quarter of 2015 (−0.9%) Household consumption expenditure on goods - December 2015
29 January 2016
2016- n° 31Despite a rebound in December (+0.7%), household consumption of goods declined over
the fourth quarter of 2015 (−0.9%) Household consumption expenditure on goods - December 2015
In December 2015, household consumption expenditure on goods picked up, growing by 0.7% in volume* after a marked decrease in November (-1.4%). In particular, expenditure on textile-clothing bounced back and food products consumption accelerated.
- Engineered goods: rebound in December, downturn over the quarter
- Textile-clothing: considerable rebound
- Durables: on the rise
- Other engineered goods: growing
- Energy: dropping again in December, downturn over the quarter
- Food products: increasing in December and over the quarter
- The variation in November 2015 is revised downwards
In December 2015, household consumption expenditure on goods picked up, growing by 0.7% in volume* after a marked decrease in November (−1.4%). In particular, expenditure on textile-clothing bounced back and food products consumption accelerated.
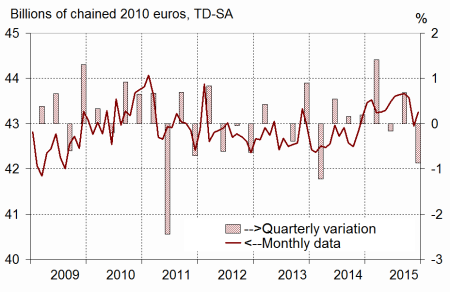
Over the fourth quarter, household consumption expenditure slipped back (−0.9% after +0.7%), driven down primarily by the sharp drop in energy consumption. However, over the year 2015, household consumption accelerated substantially (+1.8% after −0.2%), mainly due to the rebound in energy consumption.
Engineered goods: rebound in December, downturn over the quarter
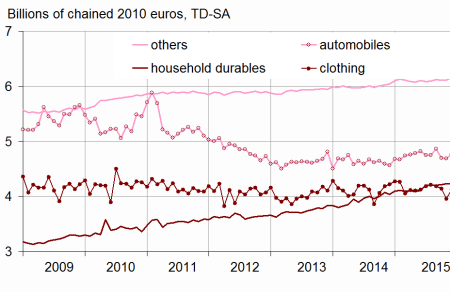
In December, purchases of engineered goods picked up (+1.6% after −0.8% in November), mainly because of textile-clothing. However, they edged down by 0.8% over the quarter.
Textile-clothing: considerable rebound
Expenditure on textile-clothing climbed markedly again in December (+4.2%) after slipping for three consecutive months. Over the fourth quarter, expenditure fell back sharply (−3.0% after +2.0%).
Durables: on the rise
In December, expenditure on durable goods kept growing (+1.1%), at faster pace than in November (+0.3%). This acceleration was driven up by a rebound in car purchases (+1.7% after −0.3%).
Over the fourth quarter, however expenditure on durable goods weakened (−0.6%), hampered notably by a dip in car purchases (−1.5% after 0.0%) as well as by a sharp slowdown in expenditure on household durables (+0.5% after +2.5%).

[* Volumes are chained and all figures are trading days and seasonally adjusted.]
graphiquegraph1_new_ang – Total consumption of goods
- Source: INSEE
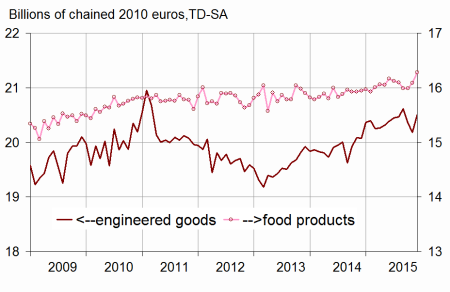
graphiquegraph2_new_ang – Food and engineered goods
- Source: INSEE
graphiquegraph3_new_ang – Breakdown of engineered goods
- Source: INSEE
Other engineered goods: growing
In December, expenditure on other engineered goods went up anew (+0.7% after a stagnation in November), thanks to hardware purchases. Over the quarter, expenditure on other engineered goods edged up (+0.5% after +0.2%).
Energy: dropping again in December, downturn over the quarter
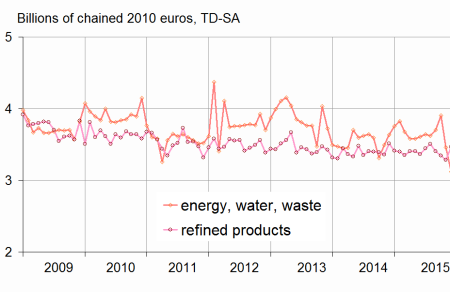
In December, energy expenditure dropped once again (−2.5% after −7.1%). In particular, spending on gas and electricity continued to plummet because of exceptionally mild temperatures, and hit its lowest level since March 2002. Conversely, consumption of refined products recovered (+5.6%, after decreasing for three months in a row), especially that of domestic heating oil.
Over the fourth quarter, energy expenditure declined sharply (−3.5% after +1.8% over the third quarter).
Food products: increasing in December and over the quarter
In December, consumption of food products gathered pace. It grew by 1.2% within a month (after +0.6%), its highest increase since June 2014. Over the fourth quarter, consumption picked up (+0.3% after −0.2%).
The variation in November 2015 is revised downwards
The variation of household expenditure on goods in November 2015 is revised downwards by 0.3 points: it now stands at −1.4%, instead of −1.1%. Indeed, since the previous publication, new information has been integrated, mainly regarding energy, and the seasonal adjustment coefficients have been updated.
graphiquegraph4_new_ang – Energy
- Source: INSEE
tableautab1_eng – Household consumption expenditure on goods
| Weight (1) | Oct. 2015 | Nov. 2015 | Dec. 2015 | Dec. 15 / Dec. 14 | Q4 / Q3 2015 | |
|---|---|---|---|---|---|---|
| Food products | 38 | 0.0 | 0.6 | 1.2 | 2.1 | 0.3 |
| Engineered goods | 44 | –1.3 | –0.8 | 1.6 | 2.2 | –0.8 |
| - Inc. Durables | 21 | –2.1 | 0.3 | 1.1 | 4.4 | –0.6 |
| - Automobiles | 11 | –3.5 | –0.3 | 1.7 | 4.5 | –1.5 |
| - Household durables | 7 | 0.2 | 0.4 | 0.0 | 4.8 | 0.5 |
| - Inc. Textile-clothing | 10 | –1.2 | –4.5 | 4.2 | –2.3 | –3.0 |
| - Inc. Other engineered goods | 13 | –0.1 | 0.0 | 0.7 | 1.9 | 0.5 |
| Energy | 18 | 2.1 | –7.1 | –2.5 | –8.0 | –3.5 |
| - Inc. Energy, water, waste | 10 | 5.5 | –11.4 | –9.8 | –14.1 | –4.4 |
| - Inc. Refined Products | 9 | –1.8 | –1.9 | 5.6 | –1.3 | –2.6 |
| Total | 100 | –0.2 | –1.4 | 0.7 | 0.3 | –0.9 |
| - Inc. Manufactured goods | 85 | –0.8 | –0.4 | 1.7 | 1.9 | –0.5 |
- (1) Weighting in the consumption expenditure on goods in value
- Source: INSEE
Documentation
Methodology (pdf,23 Ko)