


 13 April 2017
2017- n° 97Rebound in business start-ups in March 2017 Enterprise births - March 2017
13 April 2017
2017- n° 97Rebound in business start-ups in March 2017 Enterprise births - March 2017
In March 2017, the number of business births for all entreprises bounced back (+2.4% after −1.0%, seasonally and working-day adjusted). Micro-entrepreneurs' registrations recovered (+2.7%) and start-ups excluding self-managed micro-entrepreneurs kept increasing (+2.2%).
In March 2017, the number of business births for all entreprises bounced back (+2.4% after −1.0%, seasonally and working-day adjusted). Micro-entrepreneurs' registrations recovered (+2.7%) and start-ups excluding self-managed micro-entrepreneurs kept increasing (+2.2%).
graphiqueGraph1 – Business start-ups (sa-wda *)
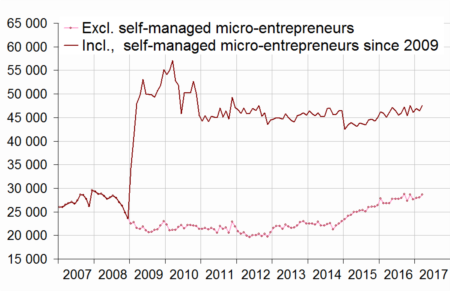
- * Seasonally and working-day adjusted data
- Source: INSEE (Sirene)
tableauTable1 – Business set-ups by month (sa-wda *)
| Dec. 2016 | Jan. 2017 | Feb. 2017 | March 2017 | |
|---|---|---|---|---|
| Excl. self-managed micro-entrepreneurs | 27,627 | 27,944 | 28,067 | 28,690 |
| Variation [m-o-m] % | -3.5 | 1.1 | 0.4 | 2.2 |
| Incl. self-managed micro-entrepreneurs | 46,059 | 46,889 | 46,403 | 47,518 |
| Variation [m-o-m] % | -3.1 | 1.8 | -1.0 | 2.4 |
- * Seasonally and working-day adjusted data
- Source: INSEE (Sirene)
+6.2% year on year (three months basis)
Compared to the same period one year before, the raw amount of births added up in the last three months speeded up in March (+6.2% after +4.2% in raw data). Every category of business start-ups went up sharply: company births (+8.2%), sole proprietorship start-ups excluding self-managed micro-entrepreneurs (+7.0%) and micro-entrepreneurs' registrations (+3.9%). Transportation and business support activities were once again the sectors that contributed the most to the overall rise1.
tableauTable2 – Business start-ups by type
| Moving total % change * | Moving total | Moving total | ||
|---|---|---|---|---|
| over 3 months | over 12 months | January- March 2017 | January- March 2016 | |
| Total | 6.2 | 5.8 | 159,063 | 149,837 |
| Companies | 8.2 | 8.4 | 54,892 | 50,725 |
| Sole proprietorships (SP) | 5.1 | 4.4 | 104,171 | 99,112 |
| SP excluding self-managed micro-entrepreneurs | 7.0 | 8.7 | 41,269 | 38,563 |
| Self-managed micro-entrepreneurs | 3.9 | 1.9 | 62,902 | 60,549 |
- * Total of business start-ups during the last 3 or 12 months compared with the same months a year earlier
- Source: INSEE (Sirene)
+5.8% year on year (twelve months basis)
The raw number of business start-ups totted up during the last twelve months kept growing strongly (+5.8% year on year after +5.6% in February and +6.2% in January). This growth was mostly a result of sole proprietorship start-ups excluding self-managed micro-entrepreneurs (+8.7%) and company births (+8.4%). At a lesser extent, micro-entrepreneurs' registrations kept rising too (+1.9% year on year after +1.6% in February).
Two business set-ups out of five are self-managed micro-entrepreneurs' registrations
In March 2017, the share of micro–entrepreneurs' registrations in the businesses set up over the twelve last months amounted to 40.0%. One year before, it was 41.5%.
tableauTable0 – Business set-ups distribution by type
| Jan. 2017 | Feb. 2017 | March 2017 | |
|---|---|---|---|
| Companies | 34.1 | 34.1 | 34.3 |
| Sole proprietorships excluding self-managed micro-entrepreneurs | 25.7 | 25.7 | 25.8 |
| Self-managed micro-entrepreneurs | 40.2 | 40.2 | 40.0 |
- Source: INSEE (Sirene)

1 The contribution of a sector to the overall variation is the observed variation of this sector, weighted by the share of this sector in the total number of births.
Revisions
The overall number of businness births in February 2017 was barely revised. It went from 46,385 to 46,403 due to the revision of raw data and the update of the SA-WDA parameters. Its variation remained at −1.0%.
Business set-ups by economic activity
graphiqueGraph2 – Trade and business support activities start-ups (sa-wda *)
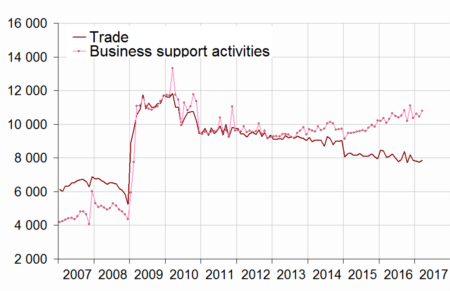
- * Seasonally and working-day adjusted data
- Source: INSEE (Sirene)
graphiqueGraph3 – Construction and transportation business set-ups (sa-wda *)
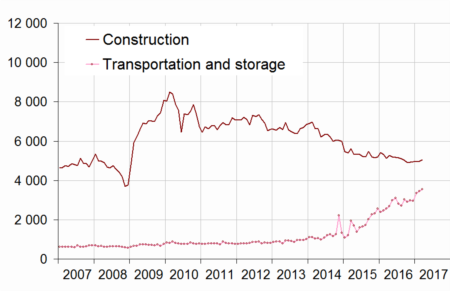
- * Seasonally and working-day adjusted data
- Source: INSEE (Sirene)
tableauTable3 – Number of business set-ups (incl. self-managed micro-enterprises)
| NA | Jan. 2017 | Feb. 2017 | March 2017 | |
|---|---|---|---|---|
| Total | 46,889 | 46,403 | 47,518 | |
| Industry | BE | 2,072 | 2,084 | 2,051 |
| Of which Manufacturing | C | 1,760 | 1,766 | 1,779 |
| Construction | FZ | 4,962 | 4,973 | 5,055 |
| Wholesale and retail trade, Transport, Accommodation and Food and beverage activities | GI | 13,759 | 13,794 | 14,011 |
| Trade | G | 7,810 | 7,758 | 7,853 |
| Transportation and storage | H | 3,349 | 3,456 | 3,557 |
| Accommodation and food service activities | I | 2,601 | 2,581 | 2,601 |
| Information and communication | JZ | 2,356 | 2,347 | 2,385 |
| Financial and insurance activities | KZ | 1,326 | 1,386 | 1,373 |
| Real estate activities | LZ | 1,669 | 1,588 | 1,738 |
| Business support activities | MN | 10,611 | 10,448 | 10,803 |
| Public administration and defence, education, human health and social work activities | OQ | 6,049 | 5,945 | 5,987 |
| Other services activities | RS | 4,086 | 3,838 | 4,115 |
- * Seasonally and working-day adjusted data
- Source: INSEE (Sirene)
tableauTable4 – Fluctuation in the number of business set-ups (incl. self-managed micro-entrepreneurs)
| NA | March 17 / Feb. 17 | Moving total % change** | ||
|---|---|---|---|---|
| sa-wda * | over 3 months | over 12 months | ||
| Total | 2.4 | 6.2 | 5.8 | |
| Industry | BE | -1.6 | 4.2 | 2.9 |
| Of which Manufacturing | C | 0.8 | 1.4 | 1.7 |
| Construction | FZ | 1.7 | -1.3 | -2.6 |
| Wholesale and retail trade, Transport, Accommodation and Food and beverage activities | GI | 1.6 | 7.1 | 8.4 |
| Trade | G | 1.2 | -2.7 | -1.7 |
| Transportation and storage | H | 2.9 | 41.5 | 48.2 |
| Accommodation and food service activities | I | 0.8 | 6.8 | 8.6 |
| Information and communication | JZ | 1.6 | 7.1 | 7.9 |
| Financial and insurance activities | KZ | -0.9 | 7.1 | 3.2 |
| Real estate activities | LZ | 9.4 | 12.1 | 9.2 |
| Business support activities | MN | 3.4 | 8.4 | 8.6 |
| Public administration and defence, education, human health and social work activities | OQ | 0.7 | 10.1 | 6.7 |
| Other services activities | RS | 7.2 | 0.5 | 0.2 |
- * Seasonally and working-day adjusted data
- ** Total of business start-ups during the last 3 or 12 months compared with the same months a year earlier
- Source: INSEE (Sirene)
Pour en savoir plus
Time series : Business demography
