

 7 April 2017
2017- n° 94In February 2017, manufacturing output continued to decrease (−0.6%) Industrial production index - February 2017
7 April 2017
2017- n° 94In February 2017, manufacturing output continued to decrease (−0.6%) Industrial production index - February 2017
In February 2017, output diminished for the third month in a row in the manufacturing industry (−0.6% after −0.9% in January). It decreased sharply in the whole industry (−1.6% after −0.2%).
- Manufacturing output decreased slightly over the past three months (−0.3%)
- Over a year, manufacturing output also edged down (−0.5%)
- In February, output tumbled in mining and quarrying, energy, water supply, waste management (−7.9% after +4.6%)
- Output diminished sharply in the manufacture of transport equipment (−2.3% after +0.1%)
- Output decreased again in the manufacture of machinery and equipment goods (−1.7% after −1.7%)
- Output decreased slightly in “other manufacturing” (−0.2% after −0.7%)
- Output tumbled again in the manufacture of coke and refined petroleum products (−4.8% after −8.4%)
- Output recovered in the manufacture of food products and beverages (+0.9% after −1.3%)

Please note: all the series are seasonally (SA) and working-day adjusted (WDA) and SA-WDA models have been updated for this publication.
The commentary shows variations of subsections by decreasing contribution. The contribution of a subsection depends on the extent of the change and on its weight.
In February 2017, output diminished for the third month in a row in the manufacturing industry (−0.6% after −0.9% in January). It decreased sharply in the whole industry (−1.6% after −0.2%).
Manufacturing output decreased slightly over the past three months (−0.3%)
Over the past three months, output went down slightly in the manufacturing industry (−0.3% q-o-q) as well as in the overall industry (−0.2% q-o-q).
Output decreased in the manufacture of food products and beverages (−1.0%) and in the manufacture of machinery and equipment goods (−0.8%). It tumbled in the manufacture of coke and refined petroleum products (−7.0%). Conversely, it increased slightly in the manufacture of transport equipment (+0.4%). It was stable in “other manufacturing” and in mining and quarrying, energy, water supply.
Over a year, manufacturing output also edged down (−0.5%)
Manufacturing output of the last three months diminished compared to the same months of the previous year (−0.5%, y-o-y). It was stable in the whole industry.
Over a year, output decreased in “other manufacturing” (−1.0%) and in the manufacture of food products and beverages (−1.9%). By contrast, it increased markedly in mining and quarrying, energy, water supply (+3.5%) and in the manufacture of transport equipment (+2.3%). It grew slightly in the manufacture of machinery and equipment goods (+0.3%) and more significantly in the manufacture of coke and refined petroleum products (+1.4%).
graphiqueGraphique1a – Monthly Industrial Production Indices
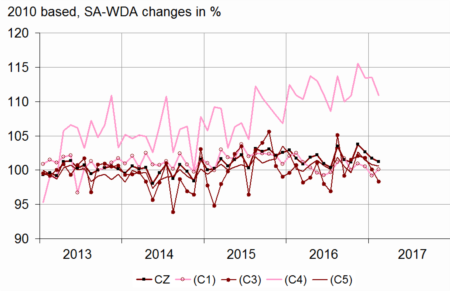
- Legend: CZ: Manufacturing - (C1): Manufacture of food products and beverages - (C3): Machinery and equipment goods - (C4): Manufacture of transport equipment - (C5): Other manufacturing
- Sources: INSEE, SSP, SOeS
tableauTableau1a – Variation in the Industrial Production
| NA : A10, (A17) | Feb. / Jan. | Jan. / Dec. | Q-o-Q change (1) | Year-on-year change (2) |
|---|---|---|---|---|
| BE: INDUSTRY | –1.6 | –0.2 | –0.2 | 0.0 |
| CZ: Manufacturing | –0.6 | –0.9 | –0.3 | –0.5 |
| (C1): Manufacture of food products and beverages | 0.9 | –1.3 | –1.0 | –1.9 |
| (C2): Manufacture of coke and refined petroleum products | –4.8 | –8.4 | –7.0 | 1.4 |
| (C3): Machinery and equipment goods | –1.7 | –1.7 | –0.8 | 0.3 |
| (C4): Manufacture of transport equipment | –2.3 | 0.1 | 0.4 | 2.3 |
| (C5): Other manufacturing | –0.2 | –0.7 | 0.0 | –1.0 |
| DE: Mining and quarrying; energy; water supply; waste management | –7.9 | 4.6 | 0.0 | 3.5 |
| FZ: CONSTRUCTION | 8.1 | –3.6 | 0.3 | 2.6 |
- (1) Last three months / previous three months
- (2) Last three months / same three months of previous year
- The codes correspond to the level of aggregation A 10 (A 17) of the "NA" aggregated classification based on the French classification of activities NAF rev.2.
- Sources: INSEE, SSP, SOeS
tableauTableau2a – Variation in the Industrial Production
| NA : A10, (A17), [A38 or A64] | Feb. 2017 | Feb. / Jan. | Jan. / Dec. | Quarter-on-quarter change |
|---|---|---|---|---|
| BE: INDUSTRY | 100.1 | –1.6 | –0.2 | –0.2 |
| CZ: Manufacturing | 101.2 | –0.6 | –0.9 | –0.3 |
| (C1): Man. of food products and beverages | 100.1 | 0.9 | –1.3 | –1.0 |
| (C2): Man. of coke and refined petroleum products | 80.9 | –4.8 | –8.4 | –7.0 |
| (C3): Machinery and equipment goods | 98.4 | –1.7 | –1.7 | –0.8 |
| [CI] Man. of computer, electronic and optical products | 107.1 | –0.9 | 4.5 | 2.1 |
| [CJ] Man. of electrical equipment | 88.3 | 2.9 | –5.4 | –2.0 |
| [CK] Man. of machinery and equipment n.e.c. (1) | 95.4 | –4.8 | –5.9 | –3.2 |
| (C4): Man. of transport equipment | 110.9 | –2.3 | 0.1 | 0.4 |
| [CL1] Man. of motor vehicles, trailers and semi-trailers | 103.0 | –1.3 | –3.7 | 2.0 |
| [CL2] Man. of other transport equipment | 118.8 | –3.1 | 3.5 | –0.9 |
| (C5): Other manufacturing | 100.6 | –0.2 | –0.7 | 0.0 |
| [CB] Man. of textiles, wearing apparel, leather and related products | 82.6 | –5.7 | –2.6 | –2.3 |
| [CC] Man. of wood and paper products; printing and reproduction of recorded media | 85.8 | 1.9 | –0.6 | –0.4 |
| [CE] Man. of chemicals and chemical products | 117.9 | –1.1 | –2.5 | 0.9 |
| [CF] Man. of basic pharmaceutical products and pharmaceutical preparations | 111.9 | –6.1 | 2.4 | 4.2 |
| [CG] Man. of rubber and plastics products, and other non-metallic mineral products | 100.0 | 3.6 | –2.4 | 0.4 |
| [CH] Man. of basic metals and fabricated metal products, except machinery and equipment | 97.0 | 1.6 | 0.0 | –0.7 |
| [CM] Other manufacturing; repair and installation of machinery and equipment | 98.6 | 0.0 | –0.4 | –1.7 |
| DE: Mining and quarrying; energy; water supply; waste management | 92.9 | –7.9 | 4.6 | 0.0 |
| [BZ] Mining and quarrying | 98.9 | 18.8 | –12.7 | –3.2 |
| [DZ] Electricity, gas, steam and air-conditioning supply | 90.7 | –10.8 | 6.4 | 0.0 |
| [EZ] Water supply; sewerage, waste management and remediation | 106.8 | –0.1 | 2.4 | 1.9 |
| FZ: CONSTRUCTION | 92.9 | 8.1 | –3.6 | 0.3 |
| MIGs (2) | ||||
| Capital goods | 102.4 | –1.1 | 0.1 | –1.1 |
| Intermediate goods | 99.5 | 1.8 | –2.6 | –0.2 |
| Consumer durables | 102.9 | –2.3 | –2.9 | 4.5 |
| Consumer non-durables | 102.6 | –1.9 | –0.1 | 0.5 |
| Energy | 91.5 | –9.3 | 5.1 | –0.1 |
- (1) n.e.c. : not elsewhere classifiable
- (2) Main industrial groupings: definition in Commission regulation EC of 14 June 2007
- Sources: INSEE, SSP, SOeS
In February, output tumbled in mining and quarrying, energy, water supply, waste management (−7.9% after +4.6%)
Output dropped sharply in electricity, gas, steam and air-conditioning supply, because of exceptionally mild temperatures in February.
Output diminished sharply in the manufacture of transport equipment (−2.3% after +0.1%)
Output fell back in the manufacture of other transport equipment (−3.1% after +3.5%) and declined again in the manufacture of motor vehicles, trailers and semi-trailers (−1.3% after −3.7%).
Output decreased again in the manufacture of machinery and equipment goods (−1.7% after −1.7%)
Output fell again sharply in the manufacture of machinery and equipment n.e.c. (−4.8% after −5.9%). It slipped back in the manufacture of computer, electronic and optical products (−0.9% after +4.5%). By contrast, it bounced back in the manufacture of electrical equipment (+2.9% after −5.4%).
Output decreased slightly in “other manufacturing” (−0.2% after −0.7%)
Output fell sharply in pharmaceuticals (−6.1%) and in textiles, clothing and footwear (−5.7%). It also decreased in chemicals (−1.1%). By contrast, it picked up in the manufacture of rubber and plastics products and other non-metallic mineral products (+3.6%) as well as in the manufacture of basic metals and fabricated metal products, except machinery and equipment (+1.6%).
Output tumbled again in the manufacture of coke and refined petroleum products (−4.8% after −8.4%)
Output dropped sharply in the manufacture of coke and refined petroleum products, due to maintenance in a refinery.
Output recovered in the manufacture of food products and beverages (+0.9% after −1.3%)
Output rebounded in particular in processing and preserving of meat and production of meat products.
tableauTableau3a – Revision of variations
| Jan. / Dec. | Dec. / Nov. | Nov. / Oct. | Q4 2016 / Q3 2016 | 2016 / 2015 | |
|---|---|---|---|---|---|
| Industry (BE) | 0.13 | –0.05 | 0.04 | –0.02 | –0.04 |
| raw serie | 0.22 | –0.04 | 0.03 | –0.03 | –0.03 |
| SA-WDA parameters | –0.09 | –0.01 | 0.01 | 0.01 | –0.01 |
| Manufacturing (CZ) | 0.11 | –0.09 | 0.06 | 0.00 | –0.04 |
| raw serie | 0.26 | –0.04 | 0.03 | –0.03 | –0.03 |
| SA-WDA parameters | –0.15 | –0.05 | 0.03 | 0.03 | –0.01 |
- How to read it: in the manufacturing sector, the SA-WDA variation between December 2016 and January 2017 is revised by +0.11 points, +0.26 points are due to the revision of the raw series and −0.15 points to the updating of the SA-WDA parameters.
- Sources: INSEE, SSP, SOeS
Documentation
Methodology (pdf,163 Ko)