

 26 February 2016
2016- n° 51In Q4 2015, French GDP increased by 0.3%. Thus GDP rose by 1.1% in 2015 as a whole Quarterly national accounts - second estimate - 4th Quarter 2015
26 February 2016
2016- n° 51In Q4 2015, French GDP increased by 0.3%. Thus GDP rose by 1.1% in 2015 as a whole Quarterly national accounts - second estimate - 4th Quarter 2015
In Q4 2015, GDP in volum terms* increased by 0.3%, thereby raising slightly the first estimate (+0.2%). On average over the year, growth climbed: +1.1% in 2015 after +0.2% in 2014.
In Q4 2015, GDP in volum terms* increased by 0.3%, thereby raising slightly the first estimate (+0.2%). On average over the year, growth climbed: +1.1% in 2015 after +0.2% in 2014.
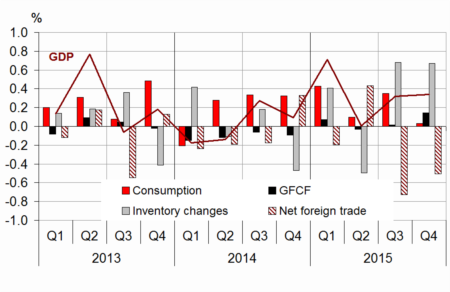
Total gross fixed capital formation (GFCF) accelerated in Q4 (+0.7% after +0.1%). By contrast, households' consumption expenditure fell back (−0.2% after +0.5% in Q3 2015). Thus, final domestic demand excluding inventory changes slowed down and contributed 0.2 points to GDP growth (after +0.4 points in the previous quarter). Exports bounced back (+1.0% after −0.6%) and imports accelerated (+2.5% after +1.7%). Overall, foreign trade balance contributed negatively again to GDP growth: −0.5 points after −0.7 points. Conversely, changes in inventories contributed positively (+0.7 points as in Q3 2015).

* This growth rate is seasonally and working-day adjusted; volumes are chain-linked previous-year-prices volumes.
tableauTab1 – Goods and services:supply and uses chain-linked volumes
| 2015 Q1 | 2015 Q2 | 2015 Q3 | 2015 Q4 | 2014 | 2015 | |
|---|---|---|---|---|---|---|
| GDP | 0.7 | 0.0 | 0.3 | 0.3 | 0.2 | 1.1 |
| Imports | 2.3 | 0.7 | 1.7 | 2.5 | 3.9 | 6.5 |
| Household consumption *expenditure | 0.7 | 0.0 | 0.5 | -0.2 | 0.6 | 1.4 |
| General government's *consumption expenditure | 0.3 | 0.3 | 0.4 | 0.5 | 1.5 | 1.6 |
| GFCF | 0.3 | -0.1 | 0.1 | 0.7 | -1.2 | -0.2 |
| *of which Non-financial corporated and unincorporated enterprises | 0.9 | 0.5 | 0.5 | 1.3 | 2.0 | 2.0 |
| Households | -0.7 | -1.1 | -0.6 | -1.0 | -5.3 | -3.3 |
| General government | 0.0 | -0.5 | -0.4 | 1.0 | -6.9 | -3.1 |
| Exports | 1.7 | 2.2 | -0.6 | 1.0 | 2.4 | 6.1 |
| Contributions : | ||||||
| Internal demand excluding inventory changes | 0.5 | 0.1 | 0.4 | 0.2 | 0.5 | 1.1 |
| Inventory changes | 0.4 | -0.5 | 0.7 | 0.7 | 0.2 | 0.3 |
| Net foreign trade | -0.2 | 0.4 | -0.7 | -0.5 | -0.5 | -0.3 |
- Source: INSEE
graphiqueGraph1 – GDP and its main components
- Source: INSEE
Total production gathered pace
Total output in goods and services accelerated in Q4 (+0.6% after +0.3%) in particular in manufactured industry (+1.1% after +0.2%). Activity in construction rebounded slightly: +0.2% after −0.8% and seven other quarters of decline. However, production in market services slowed down slightly in Q4 (+0.5% after +0.6%).
On average over the year, total output picked up (+1.4% after +0.7% in 2014), in particular in manufactured industry (+1.5% after +0.3%) and in market services (+2.0% after +1.2%). In construction, the decrease was more significant (−2.8% after −2.2%).
tableauTab3 – Production, consumption and GFCF: main components
| 2015 Q1 | 2015 Q2 | 2015 Q3 | 2015 Q4 | 2014 | 2015 | |
|---|---|---|---|---|---|---|
| Production of branches | 0.9 | -0.1 | 0.3 | 0.6 | 0.7 | 1.4 |
| Goods | 1.7 | -0.8 | 0.2 | 0.8 | 0.1 | 1.3 |
| Manufactured Industry | 1.5 | -0.5 | 0.2 | 1.1 | 0.3 | 1.5 |
| Construction | -0.6 | -0.9 | -0.8 | 0.2 | -2.2 | -2.8 |
| Market services | 0.9 | 0.3 | 0.6 | 0.5 | 1.2 | 2.0 |
| Non-market services | 0.3 | 0.3 | 0.4 | 0.4 | 1.3 | 1.2 |
| Household consumption | 0.7 | 0.0 | 0.5 | -0.2 | 0.6 | 1.4 |
| Food products | 0.2 | 0.7 | -0.1 | 0.4 | 0.2 | 1.1 |
| Energy | 3.6 | -2.5 | 1.7 | -2.4 | -5.7 | 1.7 |
| Engineered goods | 1.2 | 0.0 | 1.0 | -0.5 | 1.9 | 2.5 |
| Services | 0.3 | 0.2 | 0.2 | 0.1 | 0.7 | 1.0 |
| GFCF | 0.3 | -0.1 | 0.1 | 0.7 | -1.2 | -0.2 |
| Manufactured goods | 1.3 | 0.1 | 1.3 | 2.5 | 1.3 | 2.3 |
| Construction | -0.7 | -1.0 | -0.8 | -0.3 | -3.4 | -3.3 |
| Market services | 1.1 | 0.9 | 0.5 | 0.8 | 0.4 | 2.6 |
- Source: INSEE
Household consumption declined
Household consumption expenditure fell back by 0.2% in Q4 2015 (after +0.5% in Q3). Expenditure on goods declined (−0.5% after +0.7%), in particular on energy and on clothing. Expenditure on energy (on gas, electricity and on refined petroleum products) slipped back sharply (−2.4% after +1.7%), notably because of temperatures above seasonal norms. Spending on services, decelerated slightly (+0.1% after +0.2%), notably due to accomodation-catering.
On average over the year, household consumption accelerated (+1.4% in 2015 after +0.6%), recording its strongest increase since 2010.
Investment increased sharply
Total GFCF accelerated in Q4 2015 (+0.7% after +0.1%). Investment in manufactured goods was more buoyant (+2.5% after +1.3%), notably in transport equipment. To a lesser extent, investment in market services ramped up too (+0.8% after +0.5%). Investment in construction kept on decreasing (−0.3% after −0.8%) but at a slower pace.
Over the year 2015, total GFCF declined slightly: −0.2% after −1.2%.
External balance declined again but a slightly less than in Q3
In Q4 2015, imports accelerated (+2.5% after +1.7%), especially in transport equipment (+6.7% after +3.1%); however, those in refined petroleum products slowed down sharply (+0.3% after +10.2%). Exports rebounded (+1.0% after −0.6%), mainly due to transport equipment. All in all, foreign trade dampened activity again (-0.5 points this quarter, after −0.7 points).
On average over the year, importations accelerated (+6.5% after +3.9%), as well as exports (+6.1% after +2.4%). External balance contributed negatively to GDP growth in 2015 (−0.3 points), but to a lesser extent than in 2014 (−0.5 points).
At the end of 2015, changes in inventories contributed positively to GDP growth again
Changes in inventories contributed +0.7 points to GDP growth in Q4 2015, as in Q3 2015. Refined petroleum products and equipment goods, in particular, were stockpiled.
Over the year, changes in inventories contributed +0.3 points to activity, after +0.2 points in 2014.
Revisions
GDP growth estimation in Q4 2015 is revised upwards by 0.1 points: +0.3% instead of +0.2% initially. This revision is mainly due to the integration of new indicators not available for the first estimation, notably about household investment in new housing, spending on energy and foreign trade, and to revisions of indicators previously available.
tableauTab6 – Expenditure, receipts and net borrowing of public administrations
| 2015 Q1 | 2015 Q2 | 2015 Q3 | 2015 Q4 | 2014 | |
|---|---|---|---|---|---|
| In billions of euros | |||||
| Total expenditure | 309.0 | 311.4 | 310.8 | 1226.9 | |
| Total receipts | 290.2 | 290.8 | 290.4 | 1142.7 | |
| Net lending (+) or borrowing (-) | -18.8 | -20.7 | -20.5 | -84.2 | |
| In % of GDP | |||||
| Net lending (+) or borrowing (-) | -3.5 | -3.8 | -3.7 | -3.9 |
- Source: INSEE
tableauTab5 – Ratios of non-financial corporations' account
| 2015 Q1 | 2015 Q2 | 2015 Q3 | 2015 Q4 | 2014 | |
|---|---|---|---|---|---|
| Profit share | 31.0 | 30.8 | 31.1 | 29.5 | |
| Investment ratio | 22.9 | 23.0 | 23.0 | 23.1 | |
| Savings ratio | 19.1 | 19.4 | 20.1 | 17.4 | |
| Self-financing ratio | 83.6 | 84.1 | 87.6 | 75.2 |
- Source: INSEE
tableauTab4 – Households' disposable income and ratios of households' account
| 2015 Q1 | 2015 Q2 | 2015 Q3 | 2015 Q4 | 2014 | 2015 (ovhg) | |
|---|---|---|---|---|---|---|
| HDI | 0.9 | 0.1 | 0.6 | 1.1 | 1.5 | |
| Household purchasing power | 1.0 | -0.3 | 0.8 | 1.1 | 1.7 | |
| HDI by cu* (purchasing power) | 0.9 | -0.4 | 0.7 | 0.7 | 1.3 | |
| Adjusted HDI (purchasing power) | 0.8 | -0.1 | 0.7 | 1.3 | 1.6 | |
| Saving rate (level) | 15.3 | 15.1 | 15.4 | 15.1 | ||
| Financial saving rate (level) | 6.3 | 6.2 | 6.5 | 6.0 |
- *cu: consumption unit
- Source: INSEE
tableauTab2 – Sectoral accounts
| 2015 Q1 | 2015 Q2 | 2015 Q3 | 2015 Q4 | 2014 | 2015 | |
|---|---|---|---|---|---|---|
| Profit ratio of NFC* (level) | 31.0 | 30.8 | 31.1 | 29.5 | ||
| Household purchasing power | 1.0 | -0.3 | 0.8 | 1.1 | 1.7 |
- *NFC: non-financial corporations
- Source: INSEE
Pour en savoir plus
Time series : Operations on goods and services
Time series : Gross domestic product balance
Time series : Institutional sector accounts
Time series : Branch accounts