


 26 February 2016
2016- n° 52In January 2016, household consumption expenditure on goods rose again (+0.6%) Household consumption expenditure on goods - January 2016
26 February 2016
2016- n° 52In January 2016, household consumption expenditure on goods rose again (+0.6%) Household consumption expenditure on goods - January 2016
In January 2016, household consumption expenditure on goods grew by 0.6% in volume* (after +1.0%). Expenditure on energy bounced back sharply and consumption of household durables kept increasing at a sustained pace. However, purchases of food products fell back clearly.
In January 2016, household consumption expenditure on goods grew by 0.6% in volume* (after +1.0%). Expenditure on energy bounced back sharply and consumption of household durables kept increasing at a sustained pace. However, purchases of food products fell back clearly.
Energy: sharp rebound
In January, expenditure on energy recovered sharply (+3.4%), after two consecutive months of steep declines. The return to temperatures closer to seasonal norms led to a rebound in the expenses on gas and electricity for heating purposes. However, consumption of refined products decreased anew (−3.7%) after a strong growth in December (+5.5%).
Engineered goods: increasing again
In January, purchases of engineered goods kept growing (+0.7%), though at a slower pace than in December (+1.9%).
Durables: third month of growth in a row
In January, consumption of durables grew again (+0.6%), after a stronger rise in December (+1.6%). Spending on household durables remained sustained (+1.6%), driven primarily by purchases of consumer electronics products. However, purchases of automobiles were virtually stable (−0.1%).
Textile-clothing: more moderate growth
In January, expenditure on textile-clothing increased again (+1.4%), after a sharp rebound in December (+4.1%). The increase in January results mainly from shoes purchases.

* Volumes are chained and all figures are trading days and seasonally adjusted.
graphiquegraph1_new_ang – Total consumption of goods
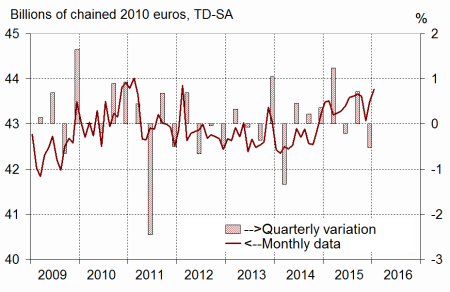
- Source: INSEE
graphiquegraph2_new_ang – Food and engineered goods
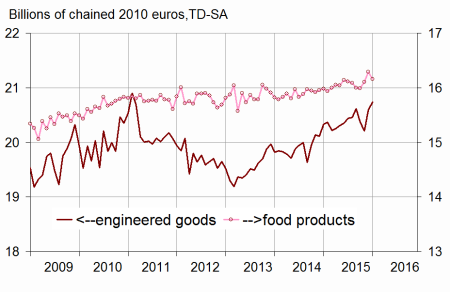
- Source: INSEE
graphiquegraph3_new_ang – Breakdown of engineered goods
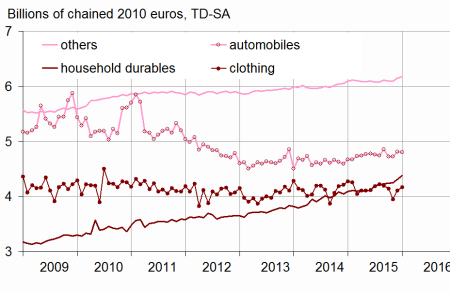
- Source: INSEE
Other engineered goods: further increase
In January, expenditure on other engineered goods grew for the second consecutive month (+0.4% after +0.9%), particularly expenditure on hardware and purchases of perfume.
Food products: sharp decline
After two months of rise, consumption of food products dropped clearly (−0.8%). In particular, consumers reduced their purchases of meat and tobacco.
The variation in December 2015 is revised upwards
The variation of household expenditure on goods in December 2015 has been revised upwards by 0.3 points: it now stands at +1.0%, instead of +0.7%. Indeed, since the previous publication, new information has been integrated, mainly regarding energy, and the seasonal adjustment coefficients have been updated.
graphiquegraph4_new_ang – Energy
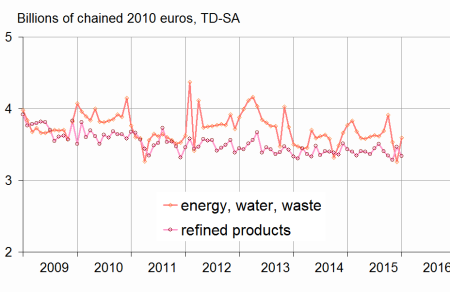
- Source: INSEE
tableautab1_eng – Household consumption expenditure on goods
| Weight (1) | Nov. 2015 | Dec. 2015 | Jan. 2016 | Jan. 16 / Jan. 15 | Q / Q-1 (2) | |
|---|---|---|---|---|---|---|
| Food products | 38 | 0,7 | 1,2 | –0,8 | 1,1 | 1,0 |
| Engineered goods | 44 | –0,8 | 1,9 | 0,7 | 2,0 | 0,1 |
| - Inc. Durables | 21 | 0,4 | 1,6 | 0,6 | 4,5 | 1,1 |
| - Automobiles | 11 | 0,1 | 1,8 | –0,1 | 2,8 | 0,2 |
| - Household durables | 7 | 0,3 | 1,6 | 1,6 | 7,1 | 2,1 |
| - Inc. Textile-clothing | 10 | –4,8 | 4,1 | 1,4 | –2,5 | –2,7 |
| - Inc. Other engineered goods | 13 | –0,1 | 0,9 | 0,4 | 1,4 | 0,7 |
| Energy | 18 | –6,1 | –1,6 | 3,4 | –3,8 | –4,7 |
| - Inc. Energy, water, waste | 10 | –9,6 | –7,9 | 10,5 | –4,7 | –7,4 |
| - Inc. Refined Products | 9 | –1,8 | 5,5 | –3,7 | –2,7 | –1,6 |
| Total | 100 | –1,3 | 1,0 | 0,6 | 0,6 | –0,4 |
| - Inc. Manufactured goods | 85 | –0,4 | 1,9 | –0,3 | 1,3 | 0,3 |
- (1) Weighting in the consumption expenditure on goods in value
- (2) Last three months / previous three months
- Source: INSEE
Documentation
Methodology (pdf,23 Ko)
Pour en savoir plus
