

 14 August 2013
2013- n° 186In Q2 2013 GDP picked up (+0.5%) Quarterly national accounts - second estimate - 2nd quarter 2013
14 August 2013
2013- n° 186In Q2 2013 GDP picked up (+0.5%) Quarterly national accounts - second estimate - 2nd quarter 2013
In Q2 2013, GDP in volume terms* rose by 0.5% after a 0.2% fall in each of the two previous quarters. It’s been the largest increase since Q1 2011. The annual growth rate carried over at the mid-year point is +0,1%.
In Q2 2013, GDP in volume terms* rose by 0.5% after a 0.2% fall in each of the two previous quarters. It’s been the largest increase since Q1 2011. The annual growth rate carried over at the mid-year point is +0,1%.
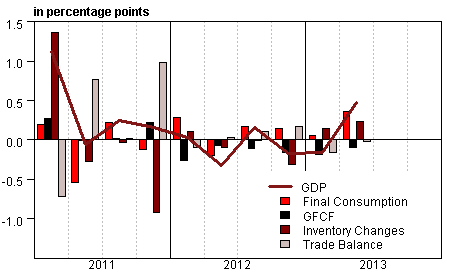
Household consumption expenditure accelerated (+0.4% after –0.1%). Total gross fixed capital formation (GFCF) decreased again, but less sharply than in the beginning of the year (–0.5% after –1.0%). All in all, final domestic demand (excluding changes in inventories) contributed to GDP acceleration: +0.3 percentage points in Q2, after –0.1 points in the previous quarter.
Both exports (+2.0% after –0.5%) and imports (+1.9% after +0.1%) rebounded. Consequently, the external trade balance made a neutral accounting contribution to GDP growth this quarter (after a contribution of –0.2 points).
Changes in inventories made a positive contribution to activity growth again: +0.2 points, after +0.1 points in Q1 2013.
Production became dynamic anew
In Q2 2013, total production of goods and services strongly accelerated: +0.9% after 0.0%. Production of manufactured goods accelerated (+2.0% after +0.2%), driven by a rebound in transport equipment production (+8.2% after –1.0%), specifically in the automotive and aircraft industries. Activity grew in all the other manufacturing sectors. Production of tradable services accelerated as well (+0.7% after 0.0%), notably in the business services.
graphiqueGraph1 – GDP and its main components
tableauTab1 – GOODS AND SERVICES: SUPPLY AND USES CHAIN-LINKED VOLUMES
| 2012 Q3 | 2012 Q4 | 2013 Q1 | 2013 Q2 | 2012 | 2013 (ovhg) | |
|---|---|---|---|---|---|---|
| GDP | 0.2 | -0.2 | -0.2 | 0.5 | 0.0 | 0.1 |
| Imports | -0.1 | -1.2 | 0.1 | 1.9 | -0.9 | 0.5 |
| Households' consumption *expenditure | 0.1 | 0.1 | -0.1 | 0.4 | -0.4 | 0.2 |
| General government's *consumption expenditure | 0.4 | 0.4 | 0.3 | 0.5 | 1.4 | 1.3 |
| GFCF | -0.5 | -0.8 | -1.0 | -0.5 | -1.2 | -2.3 |
| *of which Non financial corporated and unincorporated enterprises | -0.6 | -0.8 | -0.9 | -0.1 | -1.9 | -2.1 |
| Households | -0.4 | -0.9 | -1.4 | -1.7 | -0.4 | -3.6 |
| General government | -0.4 | -0.9 | -0.6 | 0.1 | -0.6 | -1.3 |
| Exports | 0.2 | -0.7 | -0.5 | 2.0 | 2.5 | 0.6 |
| Contributions : | ||||||
| Internal demand excluding inventory changes | 0.1 | 0.0 | -0.1 | 0.3 | -0.1 | 0.0 |
| Inventory changes | 0.0 | -0.3 | 0.1 | 0.2 | -0.8 | 0.1 |
| Net foreign trade | 0.1 | 0.2 | -0.2 | 0.0 | 1.0 | 0.0 |
tableauTab2 – Sectoral accounts
| 2012 Q3 | 2012 Q4 | 2013 Q1 | 2013 Q2 | 2012 | 2013 (ovhg) | |
|---|---|---|---|---|---|---|
| Profit ratio of NFC* (level) | 28.5 | 28.1 | 28.2 | 28.3 | ||
| Household purchasing power | -0.2 | -0.9 | 0.9 | -0.9 | 0.2 |
- *NFC: non-financial corporations
tableauTab3 – GDP and components : prices indices
| 2012 Q3 | 2012 Q4 | 2013 Q1 | 2013 Q2 | 2012 | 2013 (ovhg) | |
|---|---|---|---|---|---|---|
| GDP | 0.3 | 0.3 | 0.6 | 0.4 | 1.5 | 1.4 |
| Imports | 0.3 | 0.1 | -0.7 | -1.0 | 1.9 | -1.1 |
| Cons. Exp. : | ||||||
| - Households | 0.1 | 0.2 | 0.3 | -0.1 | 1.9 | 0.5 |
| - GG* | 0.3 | 0.1 | 0.1 | 0.0 | 1.1 | 0.4 |
| Total GFCF | 0.0 | 0.1 | 0.4 | 0.2 | 1.7 | 0.7 |
| - of which Households | -0.5 | -0.1 | 0.3 | 0.4 | 2.3 | 0.6 |
| - of which NFE | 0.1 | 0.2 | 0.6 | 0.1 | 1.3 | 0.9 |
| - of which GG | 0.4 | 0.3 | 0.1 | 0.0 | 2.2 | 0.6 |
| Exports | 0.9 | 0.2 | -0.2 | -0.3 | 1.2 | 0.1 |
- *GG: General Government
tableauTab4 – Manufactured goods : supply and uses in volume
| 2012 Q3 | 2012 Q4 | 2013 Q1 | 2013 Q2 | 2012 | 2013 (ovhg) | |
|---|---|---|---|---|---|---|
| Industrie’s production | 1.2 | -2.0 | 0.2 | 2.0 | -2.8 | 0.3 |
| - of which value added | 0.7 | -1.6 | -0.3 | 1.1 | -2.0 | -0.6 |
| Imports | -1.3 | -1.3 | 0.1 | 1.8 | 0.3 | 0.2 |
| Intermediate uses | 0.6 | -1.1 | -0.2 | 1.4 | -1.8 | 0.0 |
| Cons. Exp. : | ||||||
| - of households | 0.5 | -0.2 | -0.9 | 0.4 | -1.2 | -0.7 |
| - of GG | 0.3 | 1.6 | 2.0 | 1.3 | 4.3 | 4.6 |
| Total GFCF | -0.5 | -1.7 | -1.2 | -0.6 | -3.0 | -3.5 |
| - of which NFC | -0.6 | -2.0 | -1.5 | -0.8 | -3.7 | -4.1 |
| - of which GG | -0.3 | -0.1 | 0.0 | 0.2 | 1.0 | -0.2 |
| Exports | 0.8 | -1.3 | -0.5 | 2.9 | 3.0 | 1.1 |
| Inventory changes (contribution) | -0.6 | -0.7 | 1.1 | 0.4 | -2.5 | 0.5 |
tableauTab5 – Households’ disposable income and ratios of households’ account
| 2012 Q3 | 2012 Q4 | 2013 Q1 | 2013 Q2 | 2012 | 2013 (ovhg) | |
|---|---|---|---|---|---|---|
| HDI | -0.1 | -0.7 | 1.2 | 0.9 | 0.8 | |
| Household purchasing power | -0.2 | -0.9 | 0.9 | -0.9 | 0.2 | |
| HDI by cu* (purchasing power) | -0.4 | -1.0 | 0.8 | -1.5 | -0.2 | |
| Adjusted HDI (purchasing power) | -0.1 | -0.6 | 0.8 | -0.4 | 0.3 | |
| Saving rate (level) | 15.8 | 15.0 | 15.9 | 15.6 | ||
| Financial saving rate (level) | 6.4 | 5.7 | 6.7 | 6.2 |
- *cu: consumption unit
tableauTab6 – Ratios of non-financial corporations’ account
| 2012 Q3 | 2012 Q4 | 2013 Q1 | 2013 Q2 | 2012 | |
|---|---|---|---|---|---|
| Profit share | 28.5 | 28.1 | 28.2 | 28.3 | |
| Investment ratio | 19.3 | 19.2 | 19.0 | 19.4 | |
| Savings ratio | 13.0 | 12.0 | 12.6 | 12.8 | |
| Self-financing ratio | 67.3 | 62.8 | 66.0 | 65.9 |
Households consumption expenditures recovered
In Q2 2013, household consumption expenditure rose anew (+0.4% after –0.1%). Energy expenses remained dynamic (+2.4% after +2.0%), driven up by spring temperatures below their seasonal norms. Car purchases have picked up (+2.1% after –5.5%) for the first time since the end of 2011. Meanwhile, clothing expenses decreased again (–2.4% after –2.2%) and expenditure on food products declined (–1.2% after +1.0%). As far as services are concerned, consumption rose moderately (+0.3% after –0.1%), with a notable recovering in the accommodation and food services sector.
Investment decreased less sharply
After four quarters of decline in 2012 and a sharp decrease in the beginning of 2013 (–1.0%), GFCF declined more moderately in the second quarter (–0.5%). Non-financial corporations investment remained almost stable (–0.1% after –0.9%). Particularly, their expenses on services picked up (+0.4% after –0.6%). Public administrations investment remained sluggish (+0.1% after –0.6%). In contrast, household GFCF decreased sharply again (–1.7% after –1.4%), notably their expenditure on housing .
External trade bounced back
In Q2 2013, imports accelerated (+1.9% after +0.1% in the beginning of 2013), and so did the exports (+2.0% after –0.5%). The acceleration of the exchanges concerned almost all goods, more particularly purchases and sales of transport equipment. As a result, the accounting contribution of external trade was neutral this quarter, after a –0.2 points contribution in the first quarter.
Changes in inventories contributed positively to the GDP growth
Companies changes in inventories again contributed positively to GDP growth (+0.2 points after +0.1 points in Q1). This particularly concerned the transport equipment sector.
Revisions
Revisions of the previous quarters are of limited size, and the decrease of GDP in Q4 2012 (–0.2%) and Q1 2013 (–0.2%) are confirmed. Small revisions are mainly due to the update of the seasonal adjustment factors.
Pour en savoir plus
Time series : Operations on goods and services
Time series : Gross domestic product balance
Time series : Institutional sector accounts
Time series : Branch accounts